Google’s AI Overviews changed the shape of the SERP overnight. Some queries still send healthy traffic. Others stall out because the answer sits on the results page. If I run a B2B service company, I do not need a think piece. I need a clean way to measure CTR shifts, find where revenue risk lives, and adjust fast. The plan below treats AI Overviews like any other product change in search: measure, compare, decide, repeat.
How I Measure AI Overviews' Impact on CTR
Executive summary for busy CEOs
- I build cohorts. I group tracked queries into two buckets: AIO present vs no AIO. When helpful, I also split the AIO bucket by whether my brand is cited.
- I baseline CTR. I pull CTR by query and page from Google Search Console and set a pre-AIO baseline using a clean pre window.
- I detect AIO presence daily. I use rank tracking that flags AI Overview presence and citations. I store the AIO flag and the first detected date at the query level.
- I compare before and after. I run a pre vs post window around AIO introduction and apply a difference-in-differences comparison using non-AIO queries as the control to isolate the effect.
- I decide and act. If CTR is down, I adjust page strategy or target inclusion in AIOs. If CTR is flat, I prioritize other opportunities.
What I rely on
- Google Search Console and GA4 for organic and landing-page trends
- Rank tracking that records AIO presence and citations by query/device/country - for example, STAT does all of the above and tools like Ziptie
- A BI layer (for example, Looker Studio) and a warehouse (for example, BigQuery) for query-level time series
- A weekly reporting cadence with clear owners and next actions
Set expectations
- Early large-scale studies have reported average CTR declines for results that sit under AI Overviews - often meaningful and sometimes in the mid-30% range. Some analyses and anecdotes show clicks reduce by 20–40%. Others note that when a brand appears inside the AIO, CTR on that brand’s organic listing - and even paid ads - can lift. Google has also suggested these experiences can increase clicks (Google’s optimistic claim and leadership comments in Google). Reality varies by query type, device, and how prominently the AIO displays, so I plan for movement rather than a single effect size. Conceptually, the law of shitty clickthroughs explains why new SERP features tend to compress CTR over time.
- I keep an eye on ongoing tuning to AI Overviews (and the legacy SGE experiments) because rollouts and UI changes can shift click-through behavior week to week. Prevalence also varies by vertical and intent - see recent data on AIO prevalence.
Methodology
I use a measurement plan I can run month after month without drama. Treat this as a Google AI Overviews SEO measurement framework.
Key definitions
- AIO presence: Y or N by day and device for each query
- Brand cited in AIO: Y or N by day and device (I normalize brand variants and misspellings)
- Query buckets: brand vs non-brand, informational vs transactional, plus any strategic segments I care about (for example, verticals or product lines)
- Device and country: tracked separately, since impact often skews to mobile and to the US first
- Position controls: average position, and base organic position if my tools separate traditional organic from blended features
Controls to apply
- Position drift: I normalize or restrict to queries with stable average position in the window
- Volume floors: I set minimum impression thresholds per query per window to avoid noise (for example, 100+ impressions)
- Seasonality: I compare to the same period last year when possible and apply a non-AIO control cohort with similar intent
- SERP features: I track other features that crowd the page (People Also Ask, Top Stories, video, shopping, local packs) and map them to result types - STAT identifies the result types.
- Change log: I annotate site changes and Google updates (for example, Core Updates) to avoid mis-attribution
- Pre-trend check: I verify that AIO and non-AIO cohorts had roughly parallel CTR trends before AIO appeared
Tooling flow
- Analytics (for example, GA4) for landing-page trends and annotation of snippet or fragment clicks when present - setup examples via GTM: Brodie Clark details here
- Google Search Console for query- and page-level CTR, impressions, and position
- Rank tracking that stores AIO presence and citations by query, device, and country
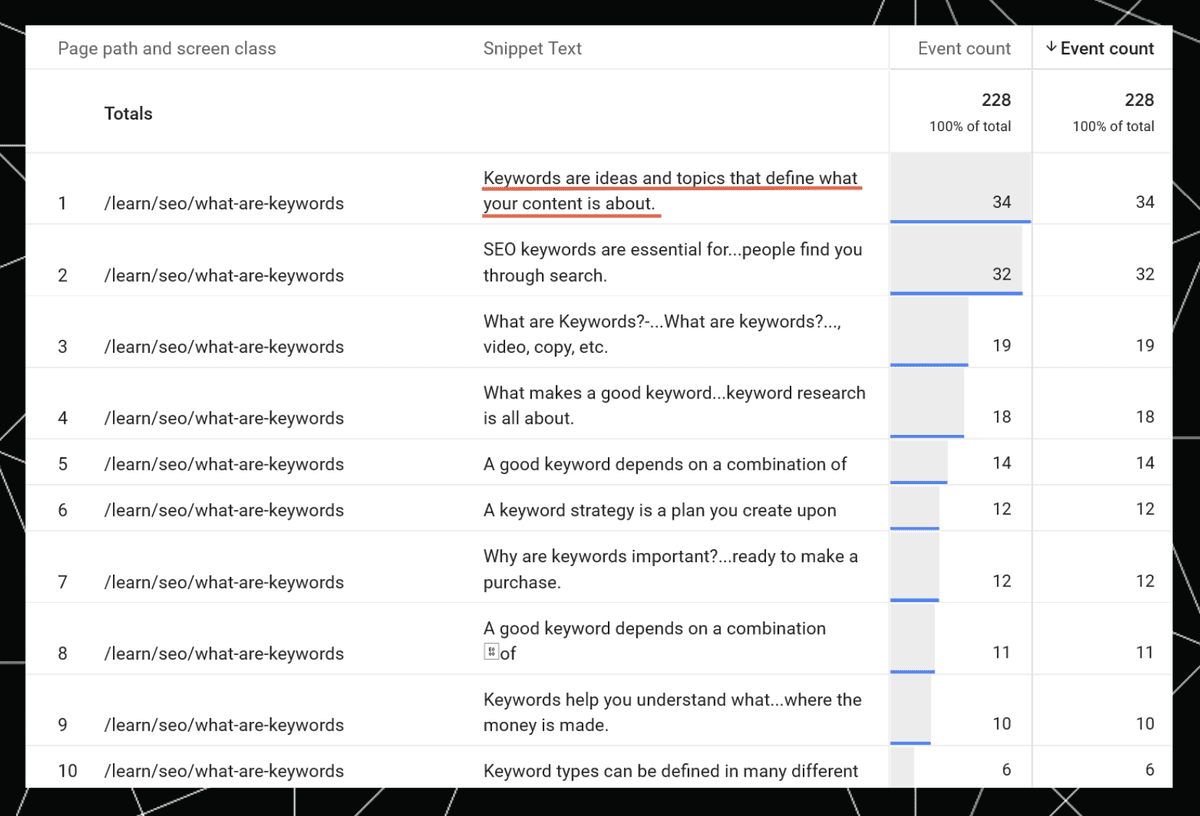
Track CTR Changes from AI Overviews
Here is how I pull and trend the numbers in Search Console so I can track CTR changes from AIO precisely.
Steps
- In GSC Performance, I switch to the Search results tab, filter by country and device, and select Query and Page dimensions.
- I export daily data for at least 90 days via the API when possible to avoid UI limits. I keep clicks, impressions, CTR, and position.
- I build two cohorts by query: AIO present vs AIO not present. I use rank-tracker output to set the AIO flag by day. Optionally, I split AIO present into Brand Cited Y vs N.
- I define windows: a 28-day pre window ending the day before first AIO detection and a 28-day post window starting the day after. If volatility is high, I extend to 56 days and align day-of-week across windows.
- I calculate weighted CTR in each window: sum of clicks divided by sum of impressions. This avoids small-sample noise. I also cap extreme query-level deltas (winsorize) to reduce outlier sway.
- I trend CTR over time with a 7-day rolling average to smooth weekends and holidays and flag dates of major Google updates.

Looker Studio widget spec
- Chart 1: Time series with CTR by cohort, device toggle, and shaded bands for pre and post windows
- Chart 2: Table by query with columns for AIO flag, Brand Cited flag, Pre CTR, Post CTR, Delta CTR, Impressions (with filters for minimum impressions)
- Controls: Date range, country, device, and a checkbox to include only stable-position queries
Monitor AI Overviews Presence in the SERP
Daily detection is the backbone of the analysis, so I monitor AIO presence in the SERP with a consistent feed.
What to capture
- AIO presence by query, country, and device
- Whether my brand is cited and where (summary, carousel card, references)
- AIO length or density tags such as short vs long, carousel vs single block, collapsed vs expanded
- Pixel height and whether organic position 1 sits above or below the fold
- First-seen date of AIO and first-seen date of my brand inside it
- A confidence rating for detection (automation vs manual verification)
Where to get it
- I use rank tracking that stores SERP HTML and flags features, ideally with device-level, time-stamped captures - STAT does all of the above. For broader AI answer monitoring, see Seer Unveils ChatGPT Tracking: Pioneering AI Answer Monitoring for ... and tools like Ziptie.
- For the top revenue queries, I add a quick manual verification protocol twice a week. A five-minute spot check catches weird SERP states that automation misses.
Data store
I maintain a query-level table with fields Query, Country, Device, AIO Presence, Brand Cited, AIO Length, Pixel Height, Above-Fold Y/N, Detection Confidence, Date. I join this to the GSC export.
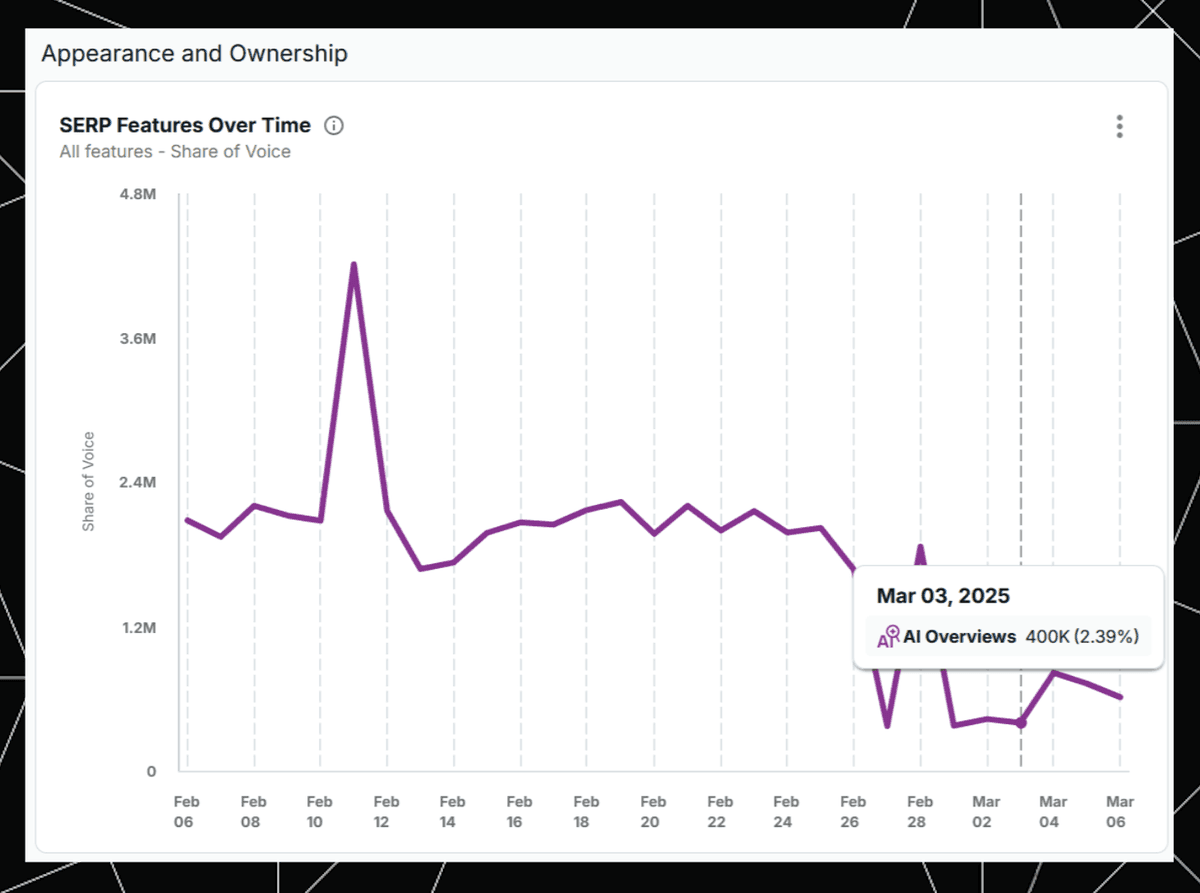
Compare CTR Before and After AI Overviews
The heart of the analysis is a clean before vs after comparison. To isolate the AIO effect, I use a difference-in-differences setup.
Design
- Windows. I pick a Pre window of 28 days before first AIO detection and a Post window of 28 days after, aligned by weekday when possible.
- Control group. I use non-AIO queries as the control, matched on intent and average position bands.
- Position control. I normalize CTR by average position bands or restrict to queries where position delta sits within a tight threshold in both windows.
- Segments. I run the analysis by device, country, brand vs non-brand, and intent.
- Statistics. With enough volume, I compute confidence intervals on the CTR deltas or run a t-test on query-level deltas. I also verify parallel pre-trends.
Simple formulas
- Weighted CTR per cohort per window = (sum of clicks) / (sum of impressions)
- DiD effect = (CTR_post_AIO − CTR_pre_AIO) − (CTR_post_noAIO − CTR_pre_noAIO)
Implementation notes
- I export GSC daily data to a warehouse and join it to the AIO table by Query, Date, Country, and Device using consistent casing and locale. This prevents messy merges.
- I visualize with side-by-side bars for Pre vs Post CTR by cohort, plus a table of query-level deltas for audit and spot checks.
Zero-Click Searches: What I Expect to See
When I blend my data with known trends from large-scale studies, I expect these patterns:
Common patterns
- Long, answer-complete AIOs drive more zero-click behavior. When the AIO covers steps, definitions, or lists, fewer users scroll to organic results. Supporting data: the SparkToro study.
- Brand cited in AIO can create a halo. When my name appears inside the AIO, users may choose my organic result below, and paid CTR can lift. It is not guaranteed, but it shows up often enough to matter.
- Intent matters. Pure informational queries show bigger declines. Transactional and comparison queries see smaller dips, and some even gain clicks when my page better answers the next question.
- Device skews the impact. Mobile losses are usually larger because the AIO pushes organic results below the fold. Desktop impact varies with screen size and layout.
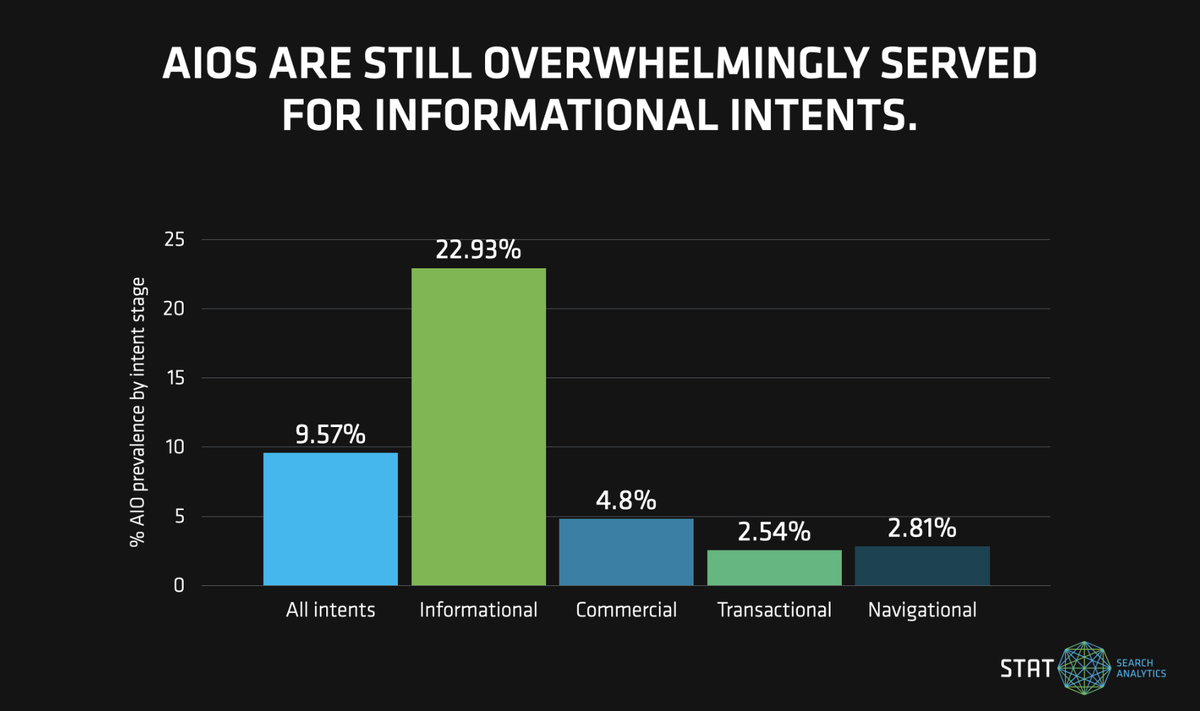
Tidy takeaways
- I expect the AIO effect on organic CTR to vary by query class and device. That is why cohorts and segments are non-negotiable.
- When I analyze SERP AI Overviews vs clicks, I do not stop at the presence flag. I include AIO length and carousel vs single block, which explain a lot of the variance.
Compact chart ideas to include in the dashboard
- CTR by AIO presence: two bars per device showing CTR for AIO present vs no AIO
- CTR by brand cited: two bars showing AIO present with Brand Cited Y vs N
- CTR impact by intent: bars for informational, how-to, comparison, transactional, each split by AIO presence
I am a CEO or Founder - What Do I Do Now?
I set the measurement, protect revenue, and then shape the SERP where it counts.
Weeks 1 to 2
- Stand up measurement. I move GSC data to a warehouse or BI layer, turn on daily SERP tracking for the core query set, and store AIO presence and brand citation. I ship a lightweight reporting view with the widgets listed earlier.
Weeks 3 to 4
- Protect high-intent pages. If a money page sits under an AIO, I tighten above-the-fold copy. I add clear comparison blocks, current pricing clarity, and a short FAQ that matches the follow-up questions in the AIO. I make the first scroll worth the click.
- Target inclusion. I craft a concise answer paragraph that mirrors the AIO prompt and cites credible sources. I use schema where relevant. I reinforce E-E-A-T across author bios, references, and case proof so my brand is a safe citation.
Ongoing with Paid Search
- Coordinate with the ad team. I shift budget toward queries with heavy AIO zero-click behavior and low organic CTR. I test responsive search ads that mirror the AIO’s wording so the ad earns trust. I watch Quality Score and bounce rates for signal.
Accountability cadence
- Run a weekly review. I review AIO presence rate, CTR deltas by cohort, and the list of high-impact queries with owners and next actions. I keep a changelog for page updates and SERP shifts.
How I attribute an organic traffic drop to AI Overviews
I separate AIO effects from other issues. I ask three quick questions:
- Did AIO presence start or grow the same week traffic dropped?
- Did average position hold steady in the same window?
- Did non-AIO control queries stay stable?
If the answers line up, I mark the drop as AIO-driven and adjust strategy by segment. If not, I check for technical issues, rank loss, Core Updates, or seasonal swings.
Micro-notes worth keeping
- Content freshness matters. When AIOs cite fresh sources, stale pages fall out of the frame.
- I think in query clusters, not single keywords. If a cluster shows the same AIO behavior, I plan at the cluster level to save time.
- I validate brand-citation parsing with spot checks to avoid false positives from similar brand names.
Final Thoughts
AI Overviews will keep changing, and so will user behavior. I treat this like long-term product telemetry for search. A clean, repeatable Google AI Overviews SEO measurement routine gives me a living view of risk and upside by query, page, and device. It also keeps the conversation grounded when budgets move and when experiments shift the page yet again.
Two closing points
- Reporting restores confidence. When the dashboard shows which cohorts lost CTR and which gained because my brand got cited, resource allocation becomes simpler. More light, less noise.
- I keep measuring and comparing. When I analyze SERP AI Overviews vs clicks month over month, patterns emerge that guide both content and ad spend.



.svg)