
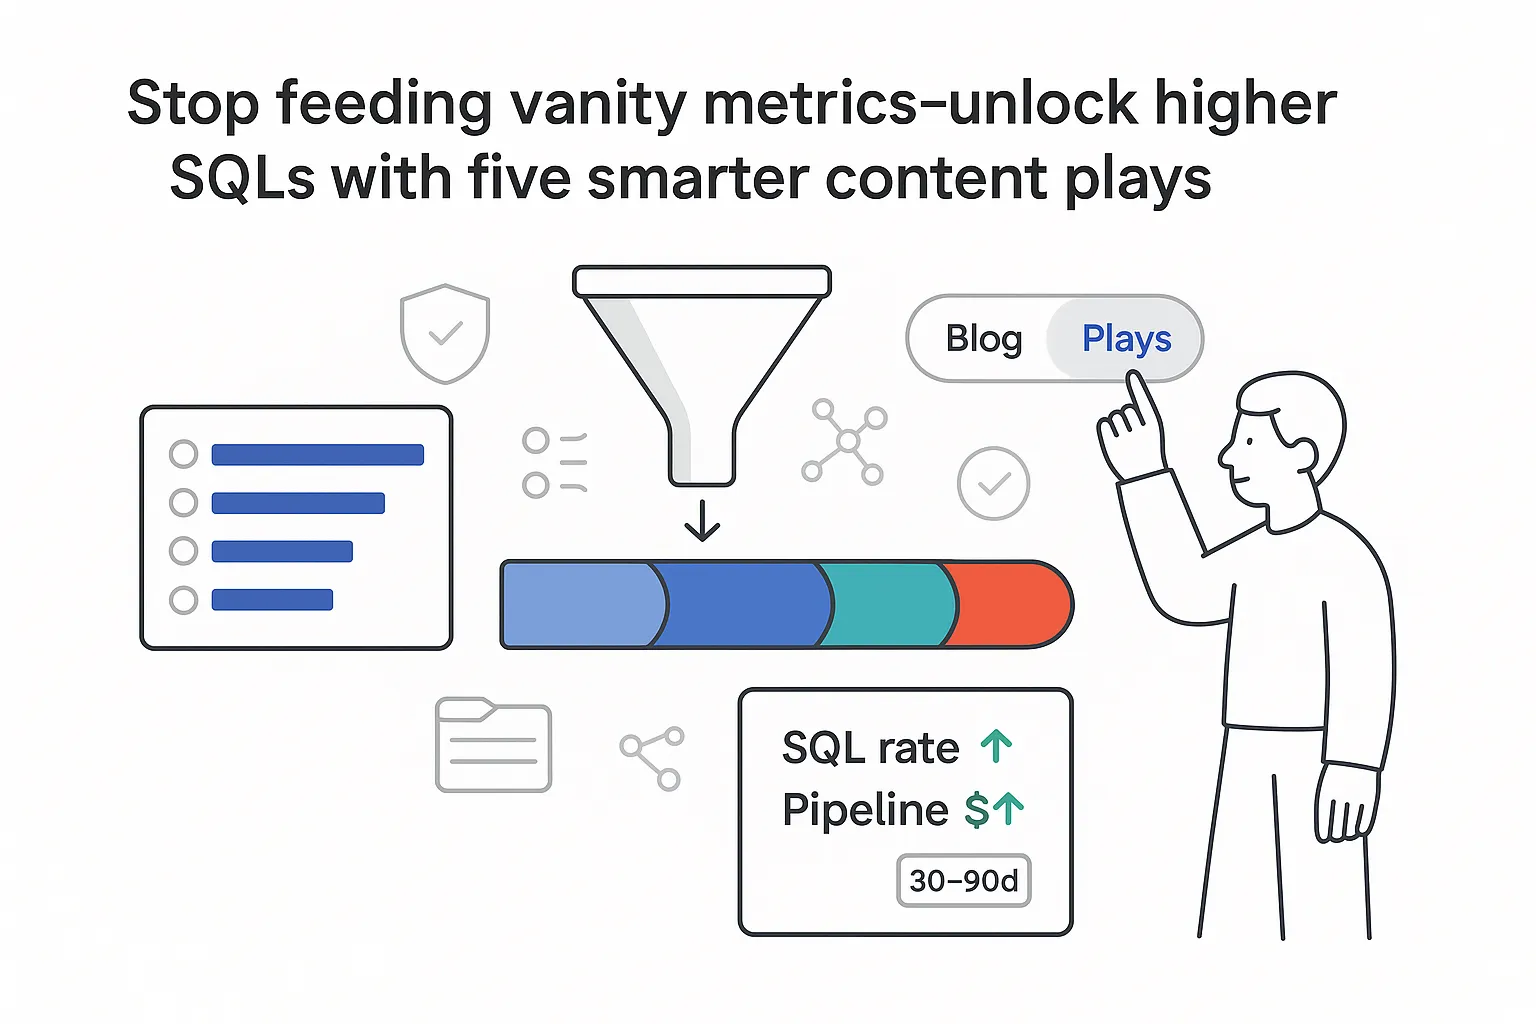
If you lead a B2B services firm and want more revenue without blowing out CAC, the path is shorter than it looks. The right B2B content types can spark pipeline in 30 to 90 days - not just traffic. Blog posts still matter, sure. But when committees compare vendors, they look for proof, clarity, and a simple next step. That means case studies, webinars, short video, and one solid research asset each year. Below I sort out what to build first, how to ship it fast, and how to measure lift in your CRM so it is not a guessing game.
B2B content types driving conversions
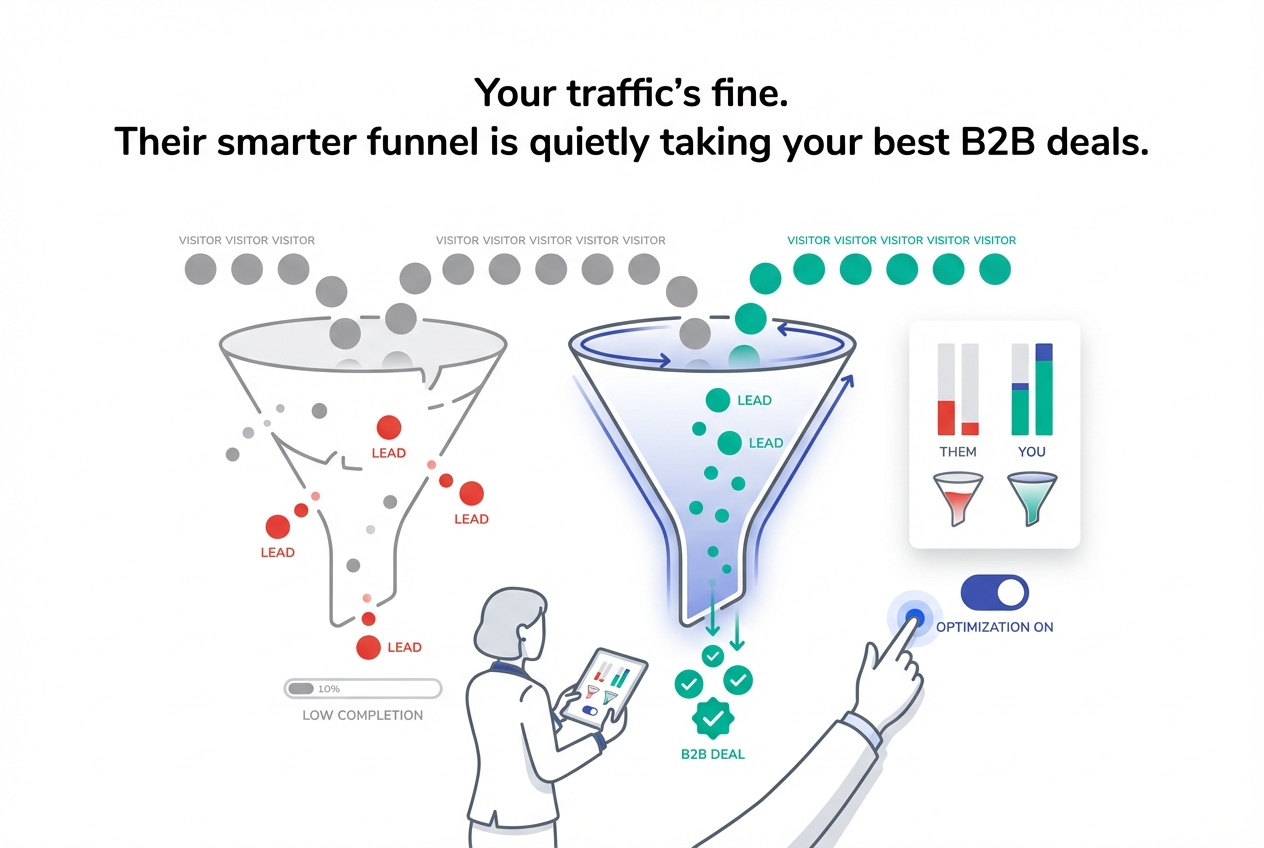
Here is the headline: content marketing often costs less than traditional ads and can drive more leads, and buyers typically consume multiple assets before they decide. One widely cited benchmark puts content at about 62 percent less cost with roughly three times as many leads compared with traditional marketing (Demand Metric). Multiple studies also show buyers consume and share several assets during evaluation, commonly three to seven or more among committees (Demand Gen Report). These are directionally useful, not absolute; your mileage depends on ICP, ACV, and sales motion. The practical takeaway for a busy CEO: one blog post will not carry the load. A small set of high-intent assets will.
Below is a field-tested ranking for B2B content types that can convert within a quarter. The figures reflect typical ranges for B2B services with ACVs from 15k to 150k and sales cycles from 45 to 120 days. “SQL rate from engaged audience” is the percentage of engaged, high-fit contacts (for example, webinar attendees, case study viewers from fit accounts, BOFU page visitors) that qualify to sales.
| Asset type | SQL rate from engaged audience | Pipeline per asset or event | CAC impact |
|---|---|---|---|
| Case study one pager + SEO page + short video | 20 to 35 percent | 30k to 150k | Lower by 10 to 25 percent via faster sales cycles |
| Live webinar with on-demand replay | 10 to 20 percent of attendees | 50k to 250k | Flat to lower by 10 percent with strong follow up |
| Productized service explainer video on BOFU pages | 5 to 12 percent of visitors | 20k to 120k per month | Lower by 5 to 15 percent due to higher page CVR |
| Annual research report with executive summary | 5 to 10 percent of high-fit leads | 150k to 500k per quarter | Neutral to lower by 10 percent via PR and links |
| Blog post cluster linked to BOFU hubs | 0.5 to 1.5 percent | 5k to 20k per post over 60 days | Neutral, drives discovery and assists conversions |
Important note on measurement: treat “pipeline per asset” as the sum of new opportunity value created (or influenced, if you use multi-touch) within a defined window, with a consistent weighting model. Keep the rules stable so trend lines are trustworthy.
Quick-start plan for this month, even with a lean team:
- BOFU: Ship one case study with a one-page PDF, an SEO version, and a 60 to 90 second testimonial cut.
- MOFU: Run one 30 to 40 minute live webinar and record it for on-demand viewing. Create three short clips from it.
- TOFU: Publish two short videos that explain a single pain and how you solve it, and seed both on LinkedIn and YouTube.
Case studies
My go-to framework: Problem, Process, Proof, Payoff. It is simple because it works. The power is in the numbers and the narrative, so a CFO or a head of ops can scan it and think yes, that looks like us and I can see the outcome. For more structure on building stories that convert, see this practical guide to B2B marketing case studies.
- Problem: One or two sentences, in the customer’s words, naming the risk or cost. Keep it human.
- Process: How the work unfolded, the playbook used, timing, and the people on both sides. A quick timeline helps.
- Proof: Measurable outcomes - both lagging numbers and leading signals.
- Payoff: Tie outcomes to money, time, or risk reduction. Spell out what it meant to the business.
Add a small ROI snapshot. This speeds vendor comparisons without a meeting. The example below is illustrative.
| Metric | Before | After | Time to value |
|---|---|---|---|
| Sales cycle days | 88 | 61 | 30 days |
| Win rate | 18 percent | 27 percent | 45 days |
| Pipeline added | — | 420k | 60 days |
| Payback period | — | 2.8 months | 90 days |
Three useful variants:
- One-page PDF for sales calls and outbound.
- SEO page with the full story, schema markup, and internal links to vertical service pages.
- A 60 to 90 second video snippet with the client voice plus a simple on-screen overlay showing the metrics above.
Small detail that moves deals: end the story with a low-friction next step like see the playbook I used. It signals confidence without pressure.
Webinars
Pick topics by starting with pain. Try a line like: How [ICP] cut [cost or risk] in 90 days without hiring. Adjust “without hiring” to match your wedge. Avoid product tours unless the goal is explicitly lower funnel.
Run it live, then extend the value with on-demand access. Keep the talk to 25 to 30 minutes and leave time for Q&A. Use a platform that maximizes reach and ease for your audience; polish matters less than clarity.
Promotion plan that keeps it simple:
- Two weeks out: create a LinkedIn Event, post the topic on your company page, personal profiles, and in relevant communities. Send a save-the-date to your house list.
- One week out: one email invite and one short video post from the speaker.
- Week of: reminder email the day before and the morning of, plus a short reminder post with a clip.
- Post event: send the replay, the slides, and three clips. Invite high-fit attendees to a short working session.
Target ranges to track (benchmarks vary by vertical; treat these as ranges, not guarantees):
- Attendance rate: 30 to 40 percent of registrants.
- On-demand views within 14 days: 20 to 30 percent of registrants.
- Demo or consult accept rate within 7 days: 10 to 20 percent of attendees.
Sales follow-up matters more than design. Use a simple SDR script:
- Open: Thanks for joining the session on [topic]. Which part matched your current plan?
- Probe: Are you looking at solving [pain] this quarter or next?
- Value: Happy to map the two or three steps I covered for your stack. 20 minutes is enough.
Service level agreements, spelled out:
- Marketing logs attendees and no-shows in the CRM within 2 hours, with the webinar topic set as a campaign.
- SDRs reach out to high-fit attendees within 24 hours. Two calls and one email in 48 hours.
- AEs receive replies from SDRs with notes and a recommended next step. Marketing provides the clips in a shared folder.
Video
Short video is where attention lives. People scan, so you need a hook within three seconds. For additional benchmarks and adoption data, see these video marketing statistics. I mix three types:
- LinkedIn explainers that run 60 to 90 seconds and cover one pain and one insight.
- Productized service explainers that run 3 to 6 minutes and sit on bottom-of-funnel pages.
- Testimonial cuts that run 30 to 45 seconds with on-screen numbers.
Script formula you can reuse: Pain, Insight, Proof, Prompt. For example, open with a common cost sink, share one counterintuitive insight, show a quick metric or client line, then a prompt like want the template I used.
Distribution plan:
- YouTube for search. Use descriptive titles, timestamps, and a clear description. Link to the related page on your site.
- LinkedIn for demand. Native uploads, punchy first line, captions on, and one strong visual frame. Tag speakers, not prospects.
- Embed on bottom-of-funnel pages like case studies, pricing, and comparison pages. Measure scroll and clicks via your analytics stack.
Keep production simple. Movement helps, but words and proof carry the weight. Add captions and a transcript for accessibility and SEO.
Research reports
One original report per year can pull weight across PR, links, and sales enablement. You do not need a huge sample to start; you do need clarity and honest method notes.
What to include:
- Methodology: how you gathered data, sample size, time frame, and any caveats.
- Dataset: who you surveyed or analyzed - roles, industries, company sizes.
- Three to five insights that are yours, not obvious, and practical.
Make it work for both awareness and pipeline:
- Release a free executive summary with key charts. Gate the full PDF only if your audience expects it. If you gate, keep the form short.
- Build vertical cuts for your target segments and use these in account outreach.
- Create a press kit with three charts, two quotes, and a one-paragraph brief. Pitch relevant editors and podcasters.
- Launch a backlink outreach sequence to blogs and newsletters that cover your niche. Reference one chart and why it matters for their readers.
Tip: publish a short companion article on your site that explains the method in plain language. It builds trust and links back to the main report.
Buyer journey mapping
I map content to the jobs it needs to do, then track those jobs in the CRM so I can see progress - not just clicks. If TOFU/MOFU/BOFU is new to you, this overview from Growth Hackers is a handy refresher.
- TOFU, demand creation: short video snippets and blog summaries that name the problem and a new way to think about it. Next-step prompts here should be light, like subscribe or get the monthly roundup.
- MOFU, education: webinars and research reports that teach the how. Next-step prompts can offer a short working session or a planning call.
- BOFU, proof: case studies and comparison sheets that let buyers check risk and outcomes. Next-step prompts can suggest a pricing consult or a pilot outline.
Gating rules:
- Ungate most TOFU. You want reach and shares.
- Gate some MOFU, but keep forms short. Name, email, company is often enough.
- BOFU can be ungated, since sales will use links in calls and emails.
CRM setup that keeps everyone honest:
- Campaign names that match assets and dates.
- Fields for first touch, last touch, and key assists like webinar-attended or report-downloaded.
- A weekly review of MQL to SQL to pipeline by asset. If you keep it light and predictable, teams will use it.
Handoff SLAs:
- Marketing logs leads and enriches within hours.
- Sales accepts or rejects within a day with a reason code.
- Feedback loops weekly, with one small change applied each time.
Why blog posts are not enough
Blog posts are a strong engine for discovery, thinking, and internal links. They rarely trigger late-stage intent by themselves. Buying committees piece together a story across many touches. A typical blog conversion rate sits around 0.5 to 1.5 percent. Compare that to a case study view from a high-fit visitor or a webinar attendee who asked a question - different energy, different outcomes.
So treat the blog as a smart distribution hub:
- Build topic hubs with clear, intent-led clusters. One hub page ties together problems, methods, and results.
- Create comparison or alternatives pages for buyers who are actively shortlisting vendors.
- Interlink to case studies, webinars, and demos wherever a post reaches a how or a why that your service solves.
- Add summaries that link to videos and reports. People skim, and that is fine. Help them move.
Long how-to guides can rank and bring solid traffic. But without nearby proof and a next step, they end up as future reading. The fix is simple - wrap blog content with proof and an easy path forward.
Content repurposing strategy
Think “anchor first, then derivatives.” One strong webinar can feed your channels for a month when you treat it as source material rather than a one-off.
A clean production line can look like this:
- One webinar becomes a transcript, three blog summaries, eight LinkedIn posts, five short videos, one email series, and a one-page guide. That is eleven or more touchpoints from a single hour.
- Name a monthly theme so SEO, social, and email all point in the same direction.
- Define roles: one owner for the anchor, one editor for derivatives, one designer for visuals, and one coordinator for distribution.
- Set a timeline with firm deadlines. Record in week one, publish the long piece in week two, release shorts in weeks two and three, and send the email series in week four.
- Quality bar: captions on every video, one strong hook per asset, and proof present where it counts.
KPI framework leadership cares about:
- Content touches per closed-won deal, tracked in your CRM with campaign influence.
- MQL to SQL rate by asset, measured weekly.
- Pipeline per asset over 30, 60, and 90 days (define whether you count created or influenced).
- Time to first value, like days from event to first meeting booked.
Two last reminders. Show the math, even if the first numbers are small. And be kind to your team’s time. Reuse the winners before you spin up the next big idea.


.svg)

.svg)
.svg)