
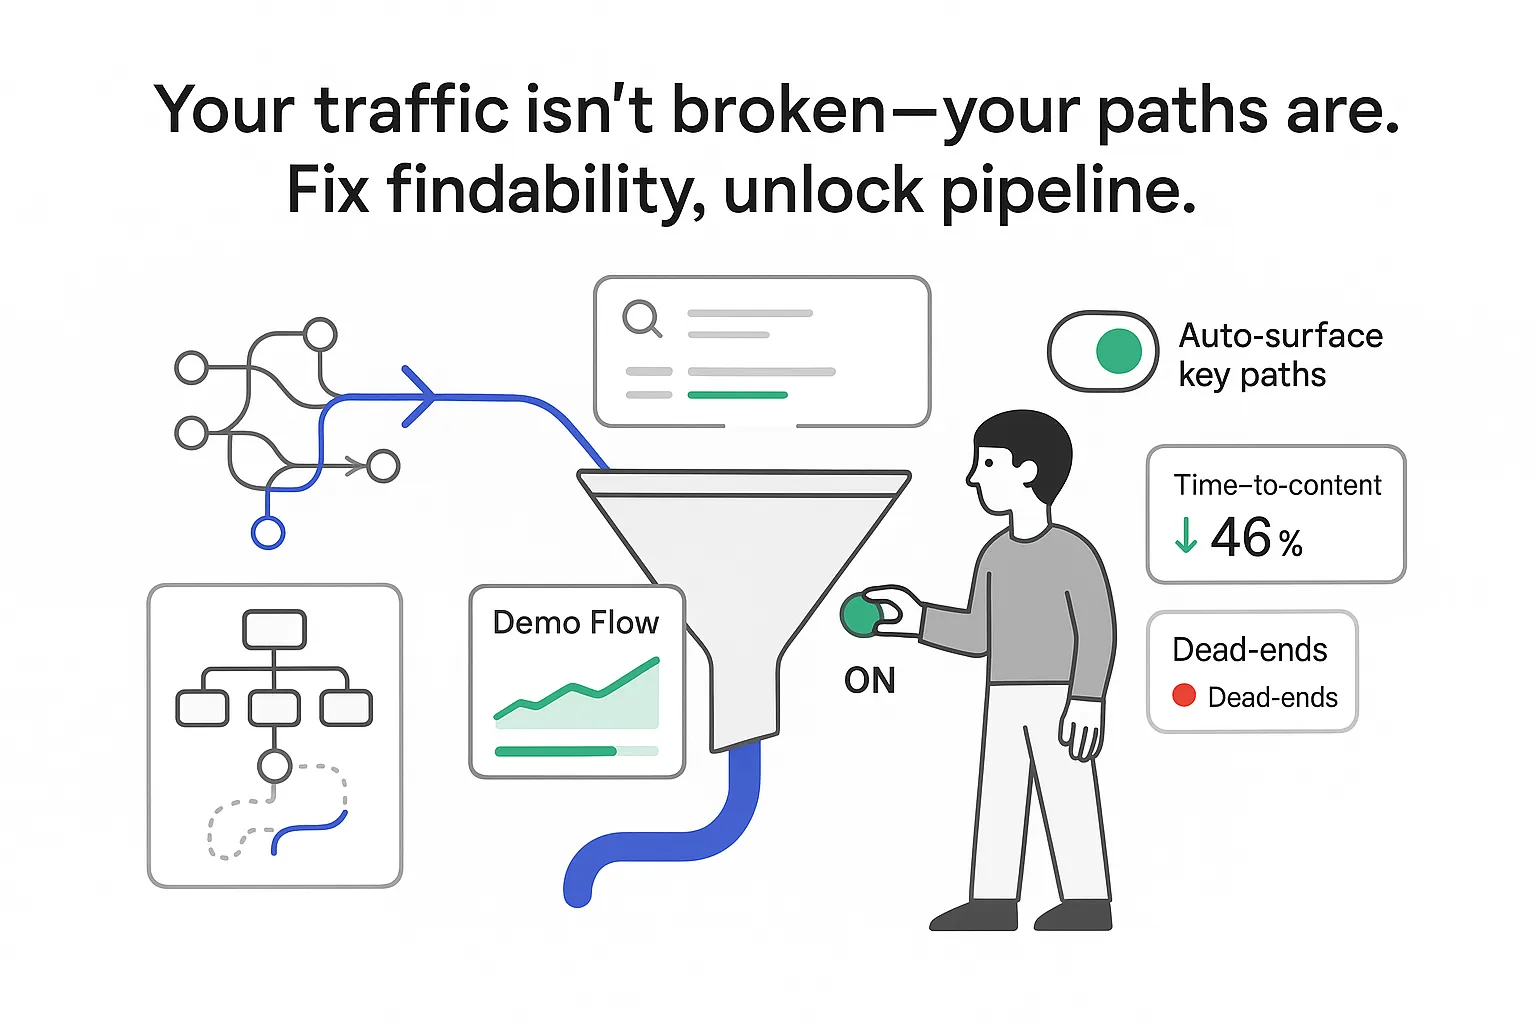
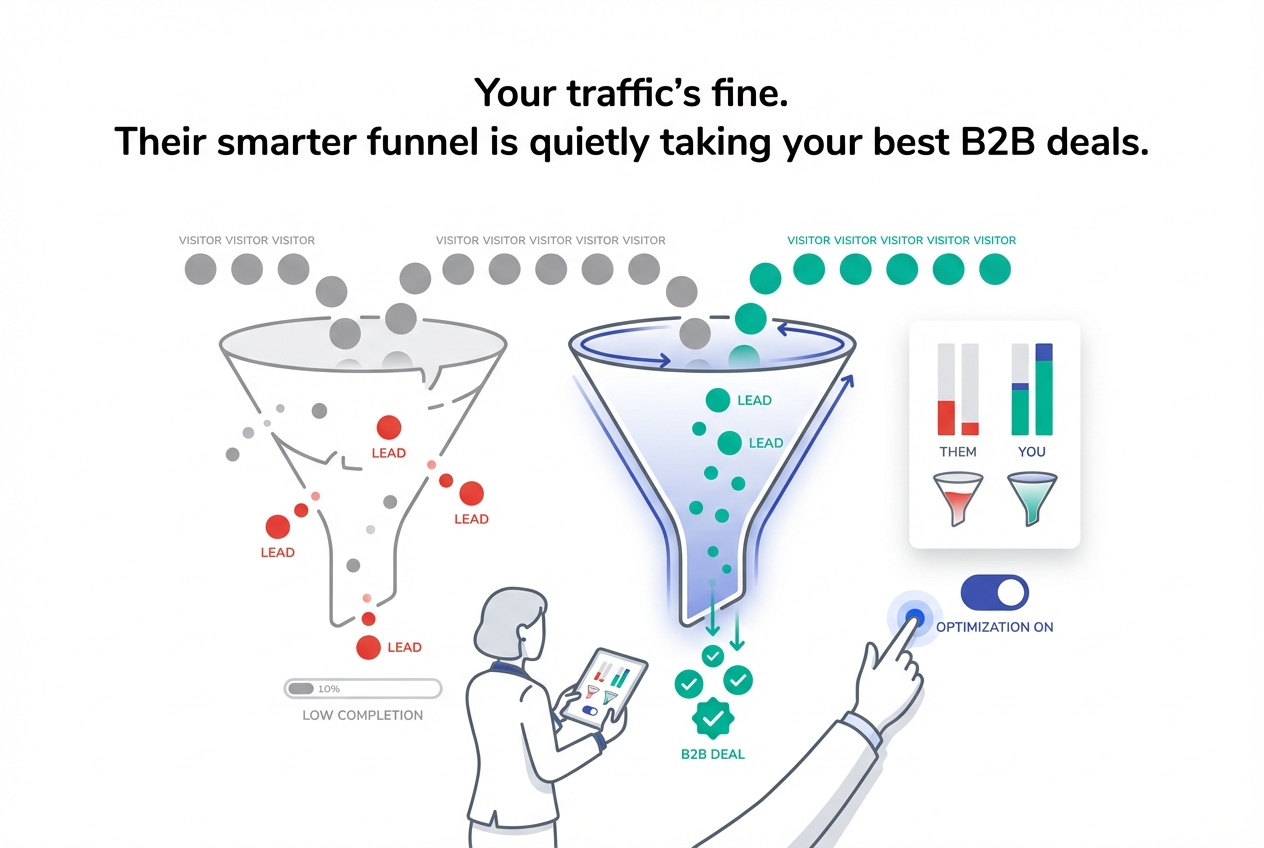
If you sell B2B services, your website either speeds up revenue or slows it down. In my experience, most teams don’t have a traffic problem; they have a findability problem. People land, get lost, and leave. Enterprise information architecture fixes that quietly, then shows its work in your numbers.
Enterprise information architecture: the quiet engine behind revenue and UX
TL;DR: Enterprise information architecture turns a sprawling website into a clear, testable path to revenue. I use it to shorten time‑to‑content for high‑intent buyers, improve search success, and nudge more visitors into demo flows or consultations. Because it’s measurable, I can hold it accountable.
Enterprise information architecture is the practice of organizing site content, labels, navigation, and search so users find the right thing, fast, at any scale. For B2B service enterprises, it maps directly to KPIs you already track:
- Conversion rate from navigation pages and key path pages
- Search success rate (a session includes a search that leads to a relevant click) and zero‑result rate (a search returns no results)
- Time‑to‑content for priority scenarios like pricing, case studies, and integration info
- Support ticket deflection through better self‑serve content paths
A practical view looks like a stack: content inventory, taxonomy, navigation, search, and governance. When each layer is solid, UX feels simple and revenue paths get shorter.
Information architecture benefits: what moves the needle
I focus on outcomes you can model in a board deck, not just theory.
- Faster discovery for buyer personas: When a CTO and a Head of RevOps can each find content labeled in their own language, comparison friction drops. That shows up as higher first‑click success and lower pogo‑sticking.
- Lower bounce from mega menus: Cleaner groupings, clear labels, and limited top‑level choices reduce overwhelm. Fewer exits on the first page mean more people enter actual journeys.
- Stronger organic findability: A consistent taxonomy improves internal linking and metadata. That helps search engines understand relationships between services, industries, and problems solved - earning more relevant impressions and clicks that turn into sales conversations.
- Governance and compliance: In large content sets, naming rules and review cycles prevent duplication and outdated advice. Fewer contradictions on the site make sales calls smoother.
A few anonymized mini‑cases that reflect what I’ve seen:
- A cybersecurity services firm reorganized its services and resource hub. Time‑to‑content for SOC leaders dropped by 43% in tests, and demo starts from nav pages rose by 28% over six weeks.
- A SaaS implementation partner added task‑based groupings and fixed label drift across 1,200 pages. Organic sessions stayed flat, yet sales‑qualified leads from organic grew by 19% because people finally found the right case studies without guessing.
- A global consultancy cut zero‑result internal searches by 52% after a taxonomy pass and better synonyms. Support ticket deflection rose by 14% as users self‑served integration docs.
Small architectural changes compound. That’s the point.
Information architecture components: the building blocks that keep you honest
Enterprise information architecture depends on a few core pieces working together.
- Content inventory: What exists, where it lives, who owns it, and whether it still earns its spot. I run a crawl, reconcile with a CMS export, and validate with real editors.
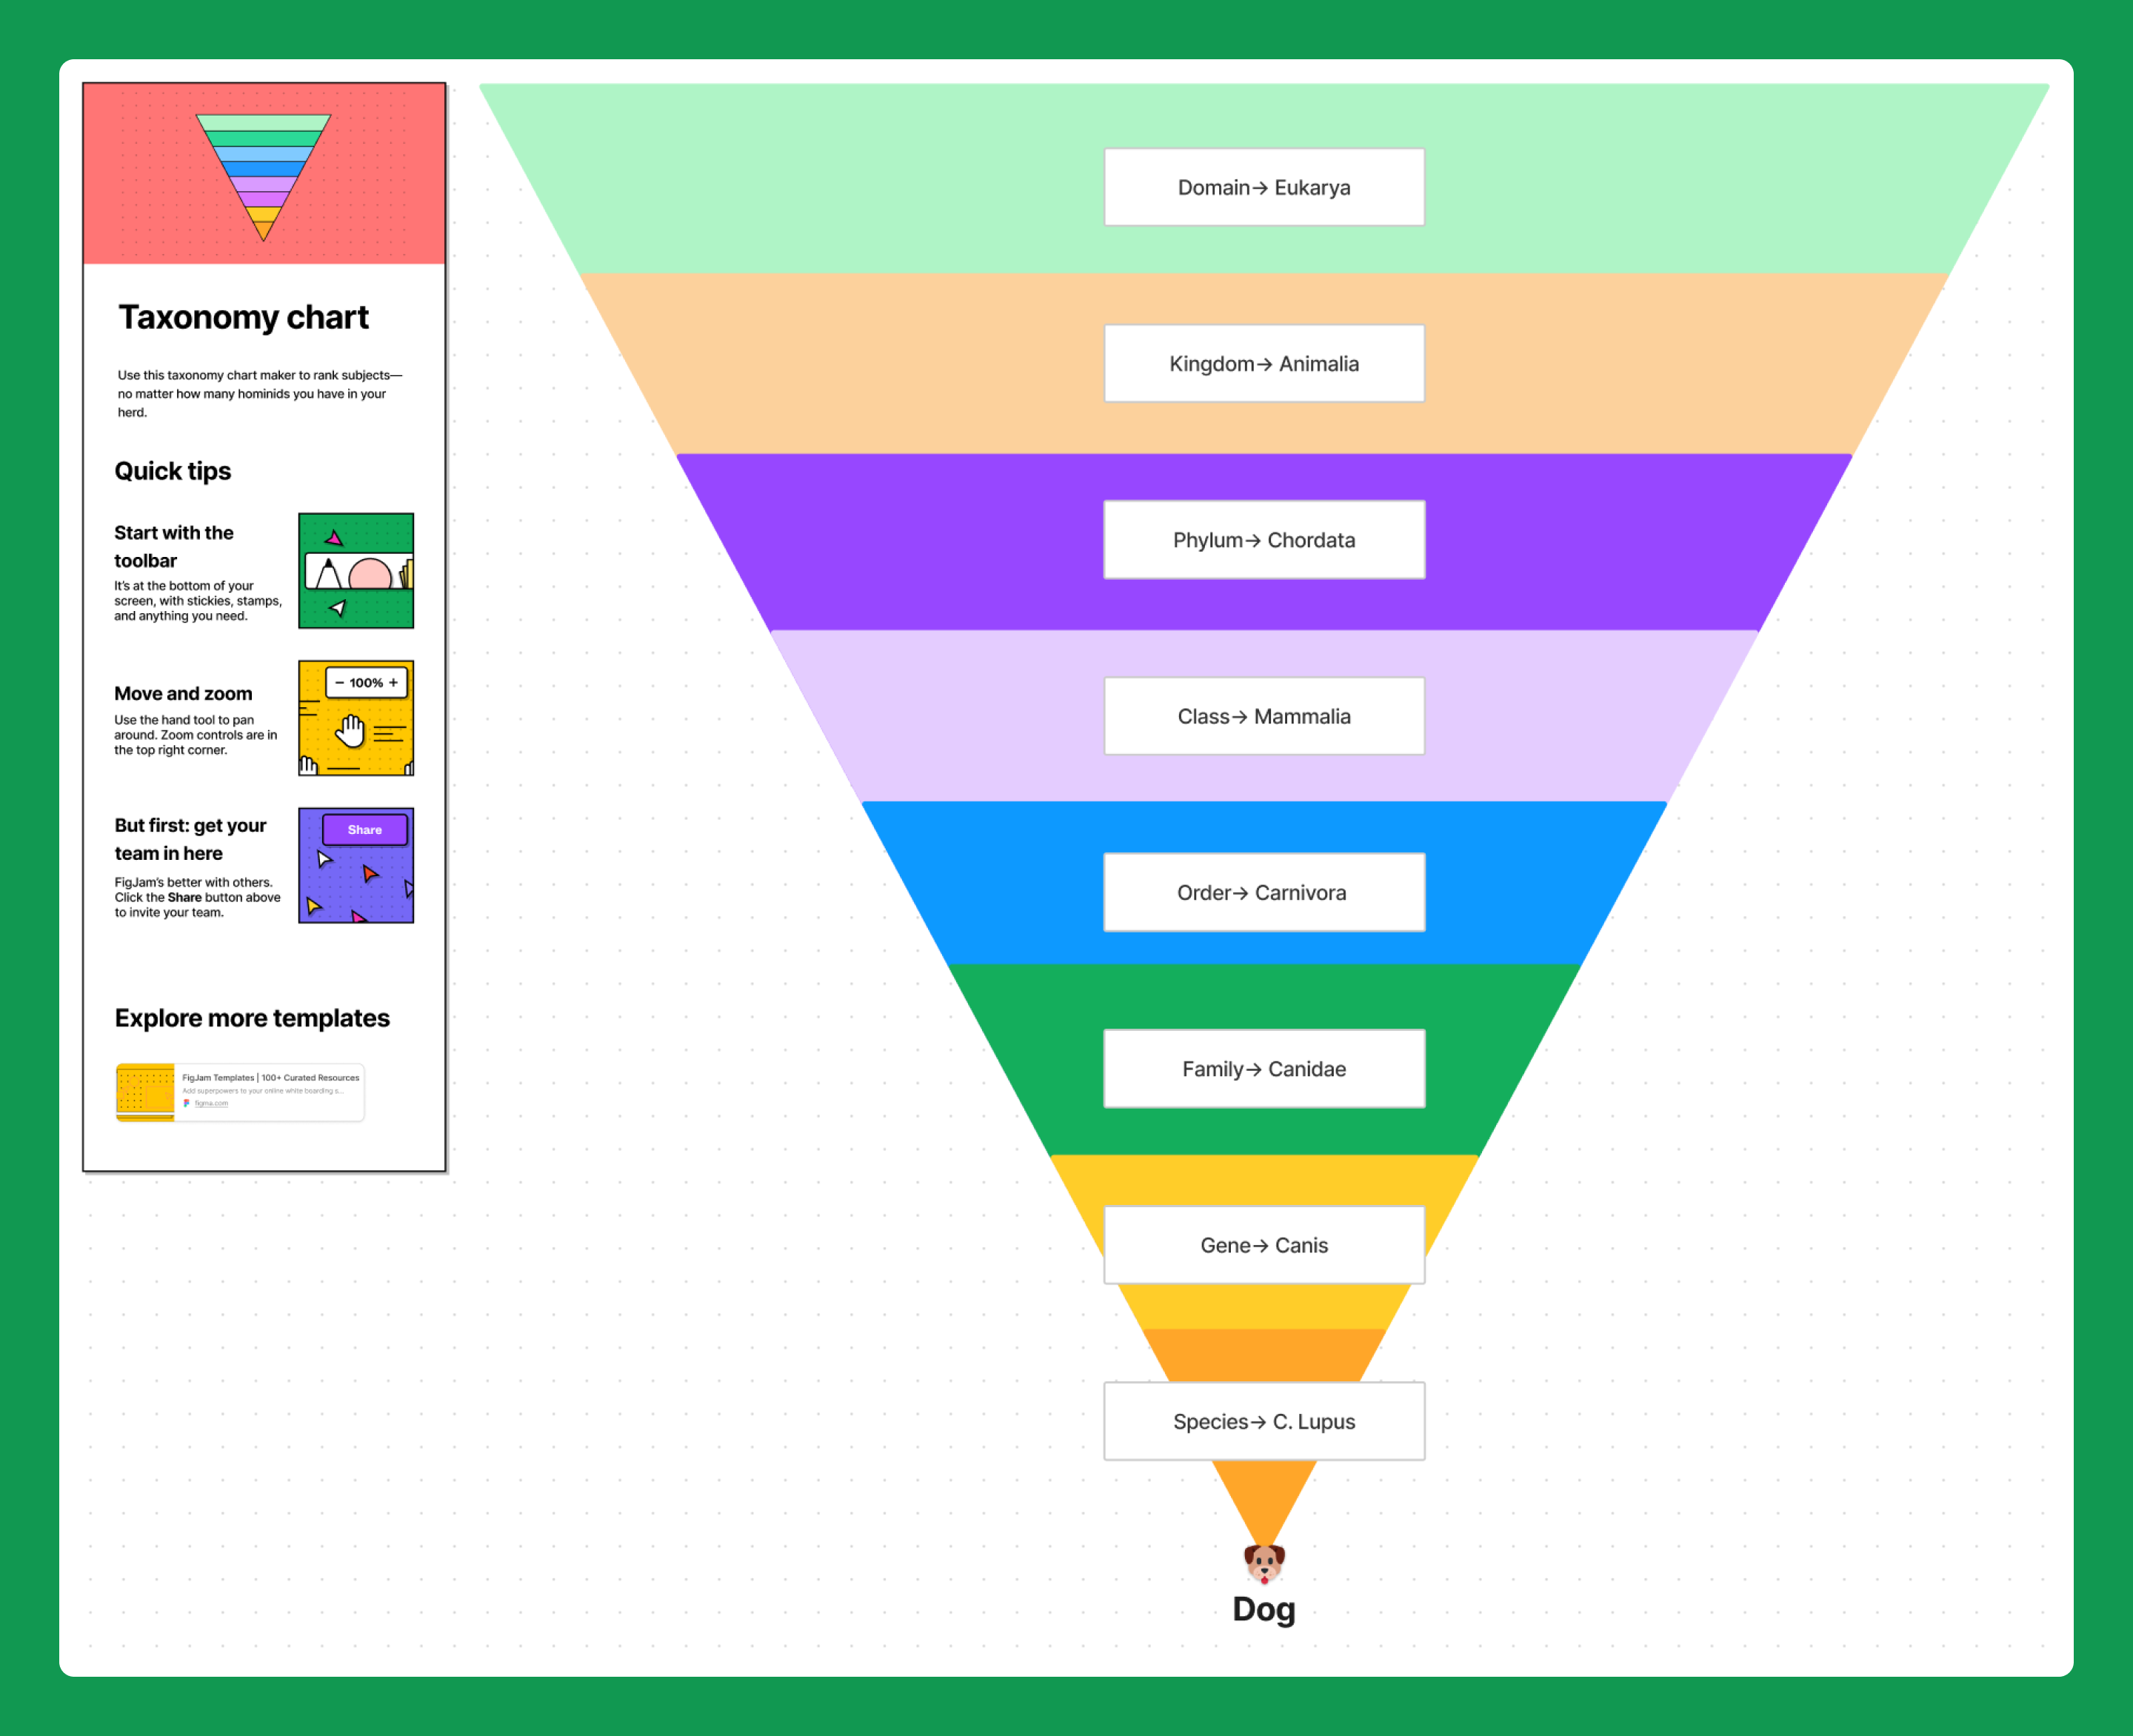
- Taxonomy: The controlled vocabulary for services, industries, solutions, and use cases. It covers preferred labels, synonyms, and relationships. I treat it as the language buyers expect, not an org chart.
- Labeling: The exact words in menus, filters, buttons, and page titles. I pick terms people say out loud and avoid inside baseball.
- Navigation: Global, local, and contextual paths that help users move from where they land to the action they want. Mega menus can work, yet grouping and prioritization matter more than sheer volume.
- Search design: Indexing rules, synonyms, faceting, and UI patterns that surface the right content quickly. Good search is IA with a prompt.
- Metadata: Structured fields that describe content type, stage, audience, industry, and technology. Solid metadata powers recommendations and keeps the site well‑stitched.
- Governance: Ownership, workflows, SLAs, and a cadence for audits. Without governance, IA decays and hard‑won clarity slips.
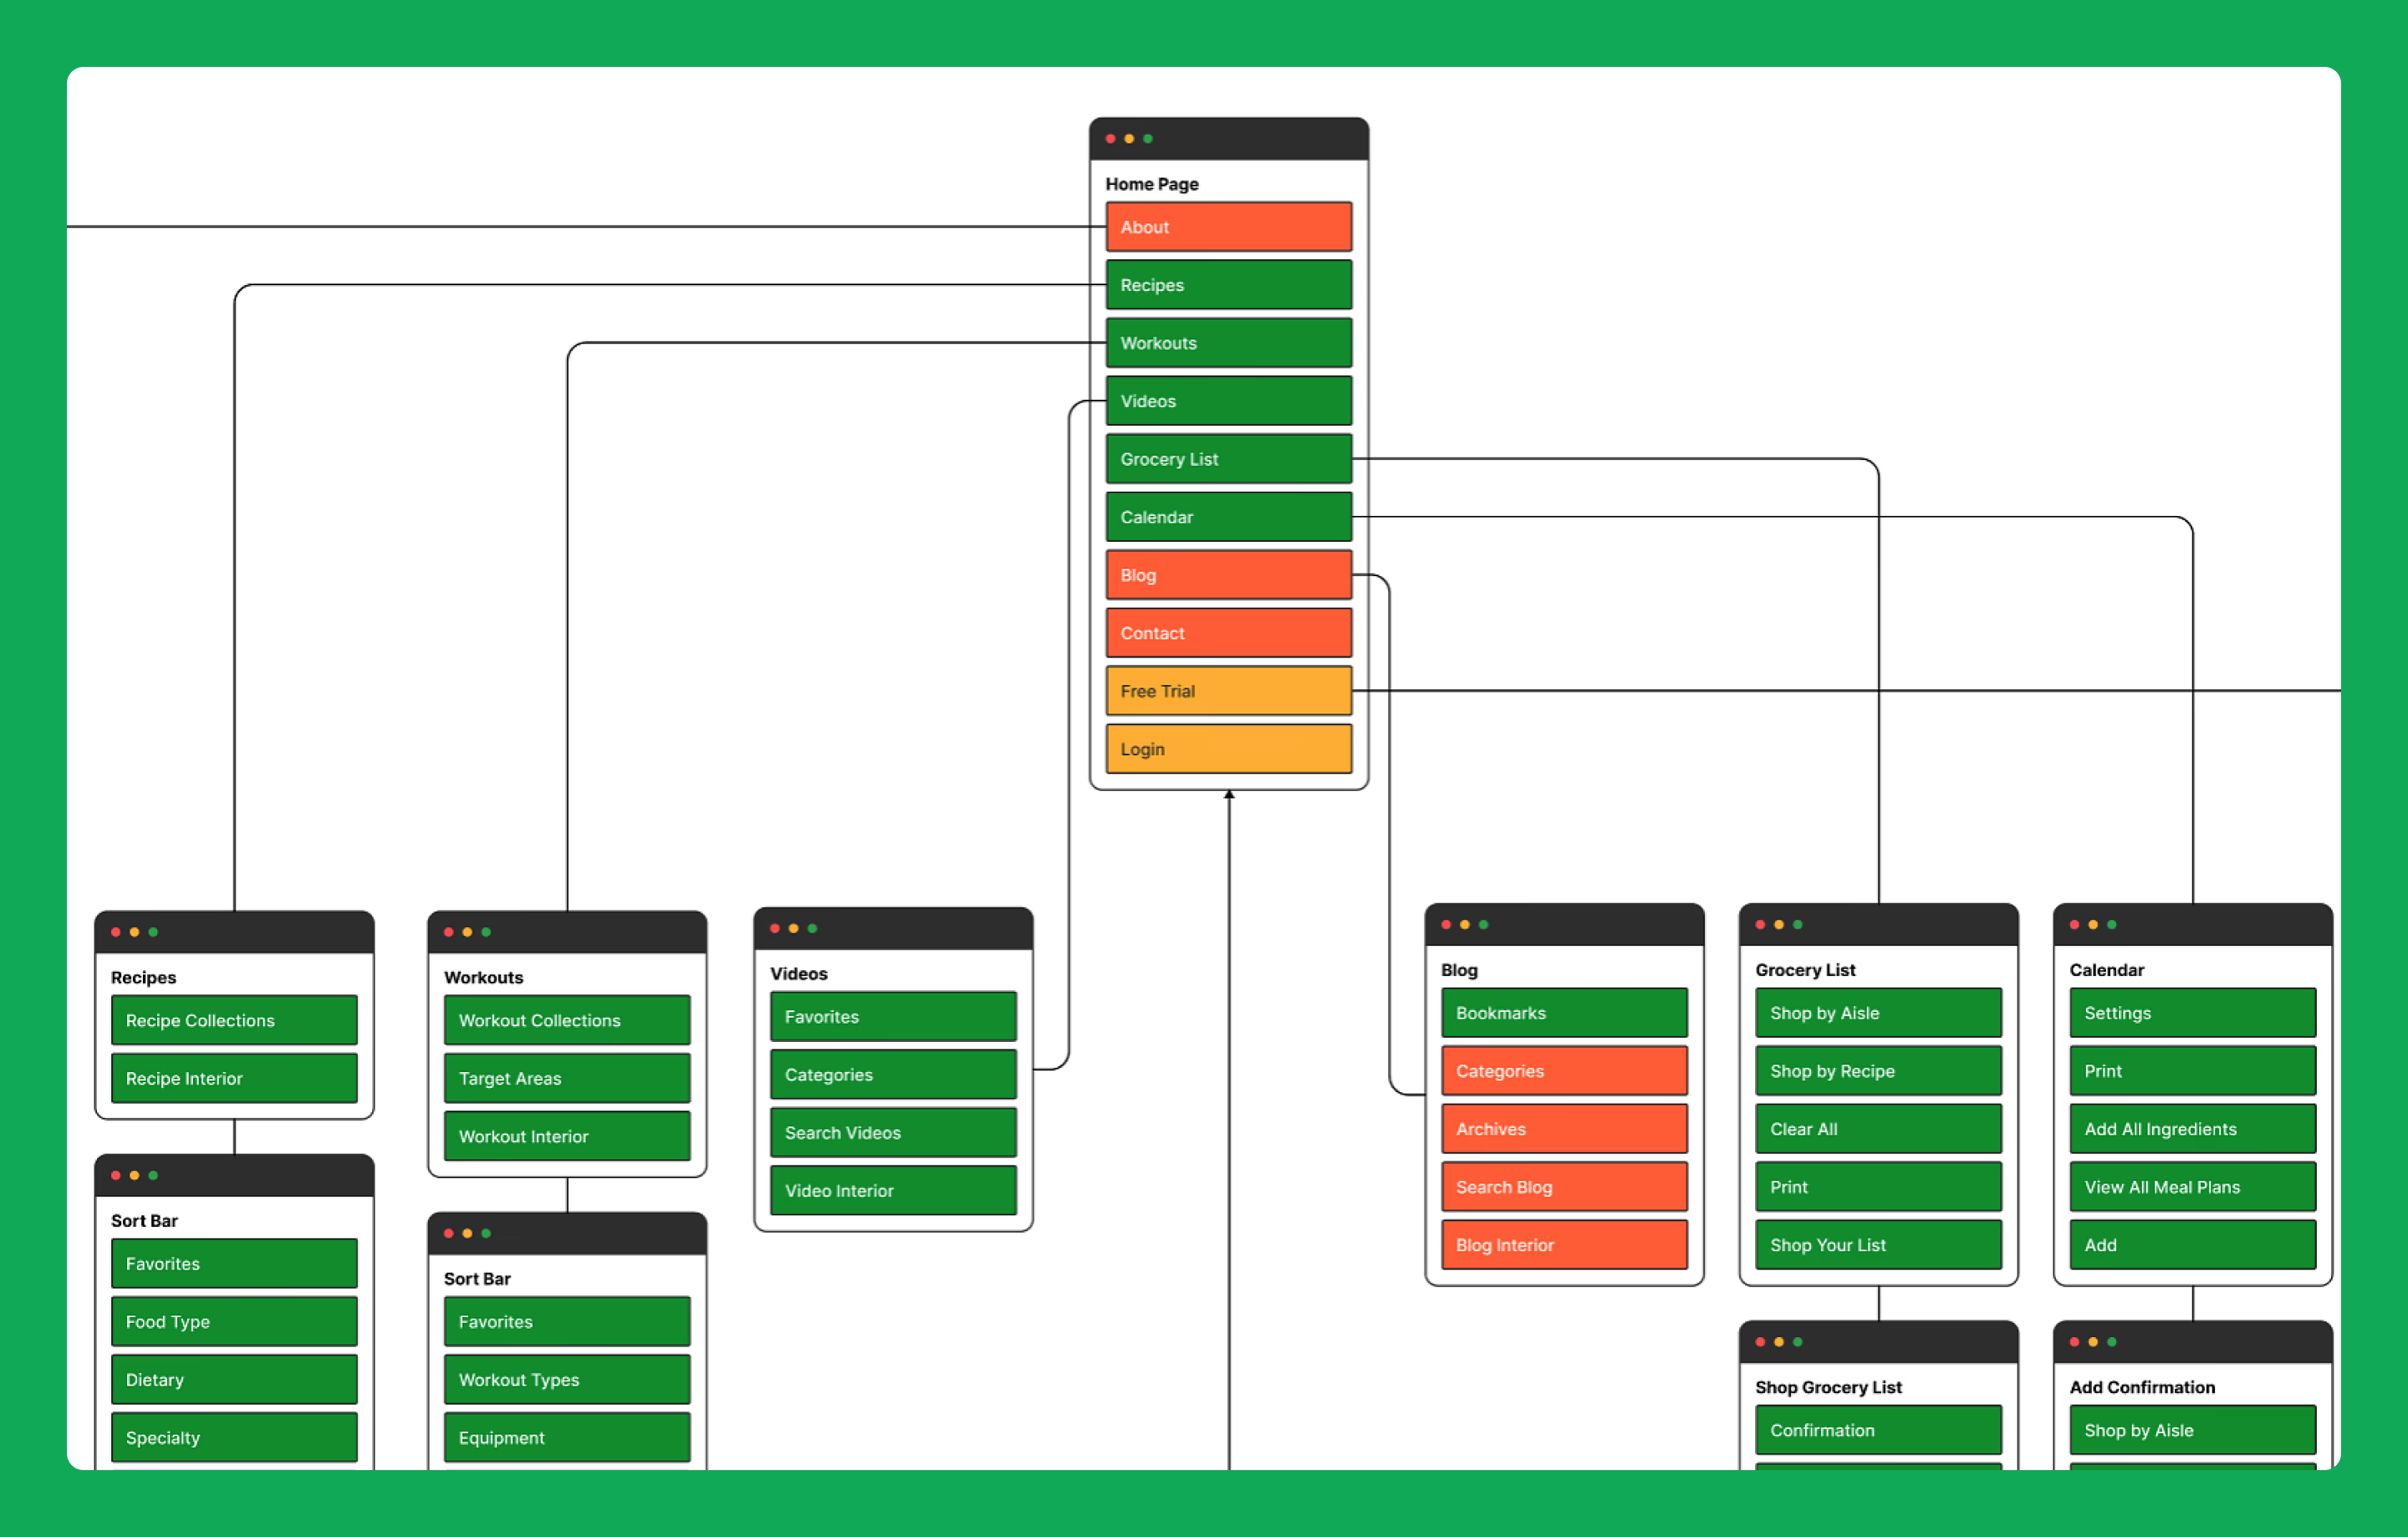
A quick clarification: information architecture vs. sitemaps. A sitemap is a snapshot of pages and their hierarchy. IA is the system behind it - labels, paths, search, taxonomy, and governance. Headers and footers are part of this. A smart header splits discovery for first‑time visitors and shortcuts for returners. A helpful footer repeats key links, reinforces trust pages, and aids crawling.
What I validate early in a program:
- Card sort and open sort to capture user language
- Tree test to validate a proposed menu
- Sitemap with page templates
- Low‑fi wireframes for navigation and search states
- Taxonomy model with synonyms and rules
- Governance playbook covering owners, review cycles, and content retirement
Navigation design models: how to organize a big site without burying the good stuff
There isn’t one perfect model. I pick based on how buyers think, then pressure‑test with research. Four common patterns show up on enterprise sites.
By department
Good when visitors already map your world through functions like Services, Industries, Resources, About. It matches many mental models. I watch for duplication when a service spans multiple departments and keep the first click focused on the visitor’s task, not internal structure.
By geographic location
Useful for global firms with legal differences, delivery teams, or region‑specific case studies. It helps users reach content that actually applies to them. The risk is fragmentation. If I go regional, I mirror global naming rules and surface shared content with clear exceptions.
By task or scenario
Great for service businesses where jobs‑to‑be‑done are clear - “Migrate to the cloud,” “Reduce churn,” “Prepare for audit.” This model reduces cognitive load because it speaks in outcomes. The pitfall is maintenance. It demands strict governance so tasks don’t balloon into vague themes.
By portfolio or offering type
Helpful when you have defined service lines or solution bundles. It presents your catalog cleanly for procurement‑minded buyers. I watch for deep nesting and orphan content. If a line is seasonal or sunsetting, I plan redirects and label updates.
Quick scenarios that match common B2B needs:
- Services and Industries: Pair a services‑first header with an industries mega menu. Cross‑link heavily between them.
- Resources: Create a task‑led hub for guides, playbooks, and calculators with filters for role and industry. Don’t bury pricing insights or implementation timelines.
- Solutions: If you sell multi‑discipline programs, lead with outcomes and show the components second.
Decision criteria I test in a week: Which model gets users to pricing and proof the fastest, with fewer backtracks and fewer internal searches?
Hick’s law: fewer visible choices, faster decisions
Hick’s Law says more choices mean slower decisions. On a big site with a big menu, that delay turns into confusion and exits. The fix isn’t minimalism for its own sake. It’s smart reduction.
Practical tactics I rely on:
- Progressive disclosure: Show primary groups first. Reveal details as users commit. In a menu, that might mean short group labels that open to well‑named children.
- Group by task, not hierarchy: Buyers care about outcomes and proof. Put those first, then internal structure below it.
- Limit top‑level items: Target 5 to 7 in testing. You can go to 8 if labels are short and scan‑friendly. Past that, scan time spikes.
- Decision‑time goals: In tree tests or first‑click tests, aim for under 2.5 seconds to pick a menu item for common tasks like Pricing, Case studies, and Services.
- Kill duplicative labels: If two items sound the same, they are the same to a busy visitor. Merge or rewrite.
Choice is good - until it isn’t. That tension is why I test before I ship.
Mobile‑first design: patterns that help busy buyers on small screens
Most B2B traffic is mobile at the top of the funnel and desktop near conversion. So yes, both matter. I start with mobile because it forces clarity.
Patterns that work for enterprise information architecture on mobile:
- Collapsible sections with clear group labels and short, scannable children
- Task‑first shortcuts like Pricing, Book a demo, and Case studies pinned near the top
- Sticky utility navigation for contact, search, and language if you serve multiple regions
- Search that’s prominent, fast, and forgiving, with rich results and typo handling
Why your CFO should care: cleaner mobile IA improves Core Web Vitals behaviorally because fewer clicks and lighter menus reduce layout shifts and interaction delays. In analytics, I watch:
- First‑click success on key tasks from the main nav
- Scroll depth on long solution pages
- Tap‑to‑search rate and zero‑result searches
- Micro‑conversions like video plays and calculator engagements
Small screens force hard choices. That pressure makes the entire IA better, including desktop.
For SEO context on mobile behavior, see Google’s stance on mobile search prioritization: Google prioritizes mobile search.
Semantic knowledge models: when your content brain needs a nervous system
As content grows, relationships matter more than folders. Semantic knowledge models bring order by defining entities and how they connect - Services, Industries, Problems, Solutions, Use cases, Partners, Technologies - and relationships like serves, applies to, solves, integrates with, proven by.
How this helps enterprise information architecture:
- Shared vocabulary: Sales, marketing, and delivery use the same terms. No more label drift between pages and PDFs.
- Faceted search and recommendations: A visitor who views a service in Healthcare can see related case studies, regulations, and integration notes without digging.
- Cross‑domain reuse: Write once, reuse across service pages, industry hubs, and proposals. A single definition lives in one place, not five.
For deeper dives and enterprise examples, see How a semantic model can elevate your EIA , guidance on operating at scale in Efficient and high-performance operation of semantic models in Enterprise Information Architecture, and practical approaches in Building an Enterprise Information Architecture from the top-down or bottom-up. For outcomes, review these Enterprise Information Architecture success stories from leading global organizations and a concrete case study to read more. If you are exploring model-driven interfaces, see Model-driven app building.
When I introduce semantics:
- Content scale: Hundreds or thousands of pages with frequent updates.
- Complexity: Many services cross industries and technologies, or the site spans multiple regions.
- Compliance: Regulated topics need consistent language and provenance.
I don’t boil the ocean. I start with a vocabulary and a simple graph that maps services to industries and proof. Open standards (for example, SKOS for controlled vocabularies and JSON‑LD for structured data) and a CMS or graph store that supports references help - but the real win is the governance that comes with them.
AI for information architecture: practical, safe, and very measurable
AI won’t replace an IA team. It speeds up the messy parts if I keep a human in the loop.
Auto‑tagging content
- I use embeddings to suggest tags based on a taxonomy.
- I set accuracy thresholds (for example, accept only above a similarity score I trust) and flag the rest for review.
- I measure time saved in editorial workflows and tagging precision on a sample set.
Clustering topics for taxonomy proposals
- I crawl content, generate embeddings, and cluster to reveal themes.
- I compare clusters to the current taxonomy to spot gaps and label drift.
- I validate with a quick card sort. AI proposes; people confirm.
Finding orphan pages and weak links
- I build a link graph to identify nodes with few internal links or no hub connections.
- I propose link targets based on semantic similarity and business priority so case studies point to the right services, not a generic blog.
Generating label variants for A/B tests
- I prompt for multiple label variants that match taxonomy rules.
- I test them in first‑click studies and controlled nav experiments, then keep winners that reduce time‑to‑content.
A simple workflow I follow:
- Crawl the site and export URLs, titles, and headings.
- Generate embeddings and cluster for topic themes.
- Compare clusters to the taxonomy and flag gaps.
- Propose new groups and synonyms.
- Run a tree test and first‑click test with 15–25 target users.
- Ship the improved menu and search synonyms.
- Monitor analytics and internal search for four to six weeks.
- Keep a monthly review with content owners to lock in gains.
Human‑in‑the‑loop matters. I set rules for acceptable precision and recall, track false positives in tagging, and use change logs. AI creates speed; governance keeps trust.
A note on privacy and risk: I don’t feed confidential docs to third‑party APIs without controls. I mask PII, run vendor DPAs, and check retention policies. Safe AI is boring AI - and that’s a compliment.
Tie IA to the metrics the board cares about
Before changing anything, I baseline:
- Conversion rate from key navigation pages and site search results
- Time‑to‑content for the top five buyer tasks
- Internal search zero‑result rate and refinement rate
- Support ticket volume for topics covered in docs
- Organic entrances to demo or consultation paths
I ship enterprise information architecture improvements in phases, not a single big bang. After each phase, I compare against baseline. If a tree‑tested menu wins but search still lags, I move to synonyms and facets next. If mobile is choppy, I fix that before adding more links. One layer at a time, with numbers, is how I build confidence.
A short, slightly odd digression that still matters: analytics naming should match labels. If the nav says Services but analytics logs it as Solutions, you’ll chase ghosts. Clean data makes better IA decisions, and better IA makes cleaner data. Funny how that works.
The final contradiction to resolve: enterprise information architecture is invisible when it’s working, yet it’s one of the few website investments you can tie straight to revenue paths, lead quality, and support costs. That invisibility is a feature, not a bug. Keep the stack tight, test as you go, and let the numbers tell the story.


.svg)

.svg)
.svg)