
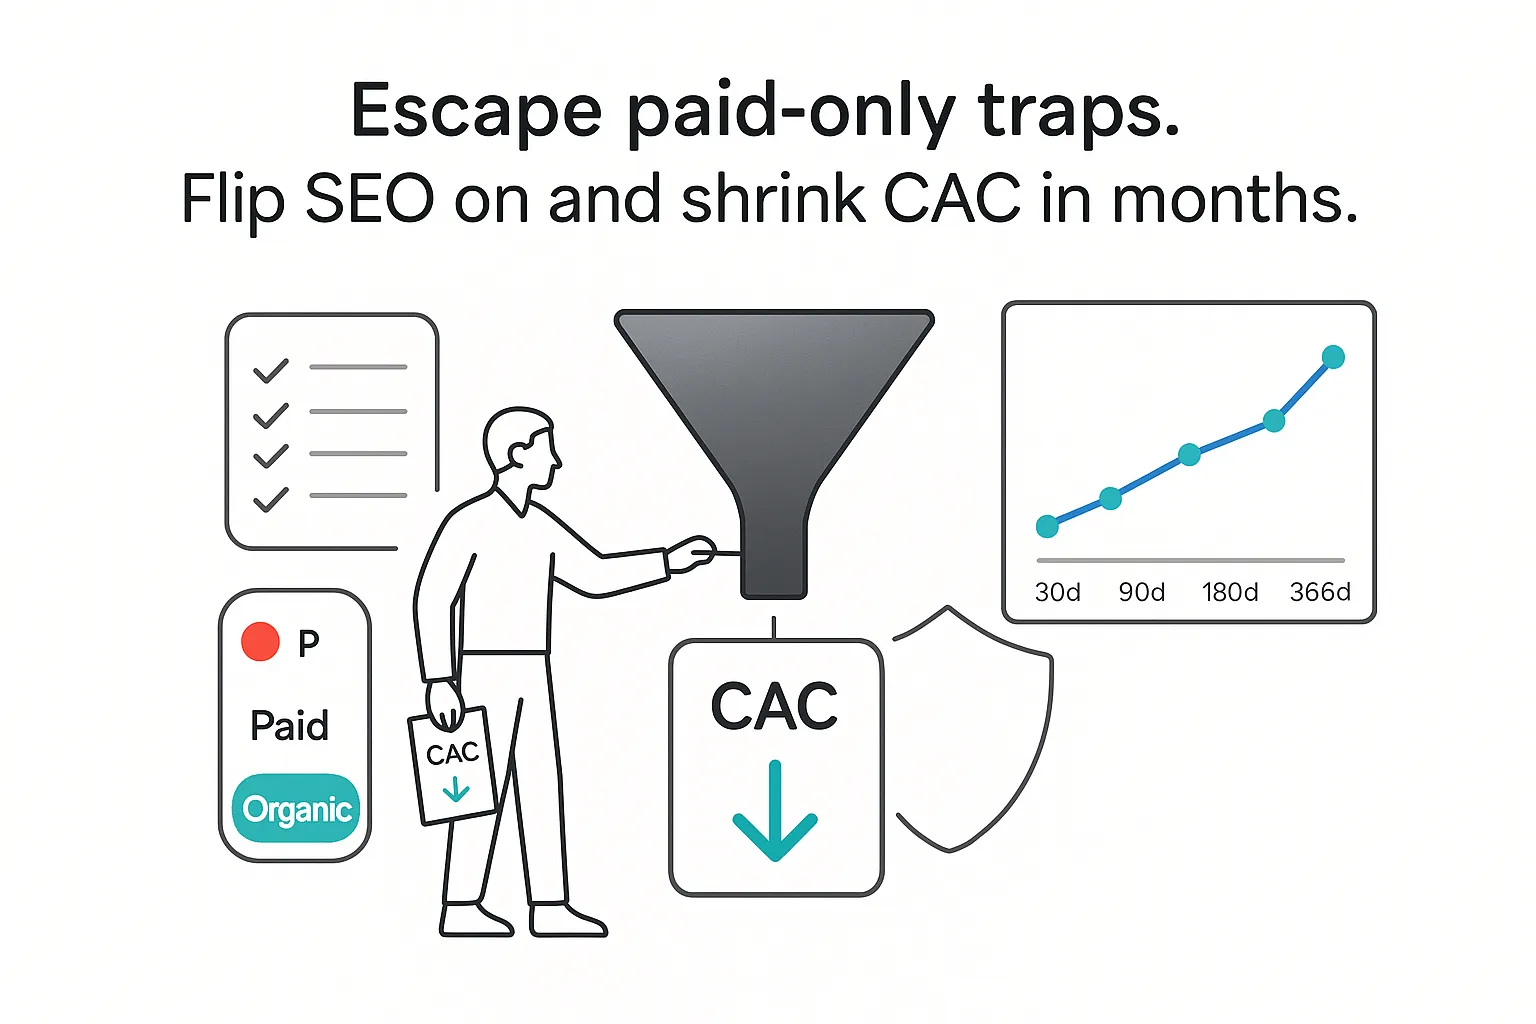
If your pipeline feels spiky and over-reliant on paid clicks, you’re not alone. I see many B2B service leaders hit a revenue plateau right when CAC creeps up and lead quality drops. Paid still matters, but it often stops compounding. This is where B2B SEO for service companies earns its keep. Done with real ownership and clear reporting, it builds an inbound engine that lowers acquisition costs while lifting qualified demand over time.
What ROI and CAC shifts I actually see
For B2B services, I typically see SEO ROI land in the 3x to 7x range over a 12‑month window when strategy is executed with precision and tracked back to pipeline. In mature categories with complex cycles, top performers can reach 8x to 12x by year two as content moats, internal links, and referring domains accumulate. CAC often drops 20 to 50 percent versus a paid-only mix because incremental organic leads keep arriving without bidding wars. Treat these as directional ranges, not promises - validate in your CRM.
Timelines I set with leaders:
- Quick wins in 30 to 90 days: crawl fixes, high‑intent page refreshes, and internal links that lift rankings hovering on page two or the bottom of page one.
- Pipeline impact in 90 to 180 days: bottom‑of‑funnel pages and comparison content begin showing up in opp creation and qualified calls.
- Scale in 6 to 12 months: topic clusters, digital PR, and consistent content velocity kick in, compounding traffic and SQL growth.
This mirrors a research abstract: outcomes improve when the work is split into focused components, measured at each stage, and verified by analytics and CRM. SEO ROI becomes predictable once ownership, cadence, and quality control are locked. Industry research on B2B buying (for example, long buying groups and self‑serve discovery) and channel ROI rankings consistently supports search as a compounding channel; the catch is making the plan accountable to personas, sales stages, and revenue, not just sessions.
What must be in place before I invest
Before spending a dollar, I confirm a few non‑negotiables. Without these, even strong execution will feel cloudy.
- ICP clarity: industries, company sizes, triggers, and disqualifiers; messaging for procurement‑heavy buyers differs from founder‑led teams.
- Closed‑loop tracking: CRM fields for source, campaign, cost, stage movement, and revenue; tidy UTMs; consistent definitions across systems.
- Analytics stack: GA4 configured with conversions; Google Search Console connected; reporting that blends traffic, quality, and revenue.
- Baseline metrics: rankings for core terms, page speed stats, index coverage, referring domains, and content inventory by stage.
- Content SMEs: people who can speak buyer language and offer proof. One subject expert can power months of credible pages and case stories.
- CMS performance: Core Web Vitals passing on key templates; clean sitemaps; access to logs for crawl audits; no heavy blocking scripts.
- Budget and time: a 6‑ to 12‑month view with monthly check‑ins, covering technical fixes, content production, and PR outreach.
- Ownership of outcomes: a named owner for each KPI and a reporting cadence. No gray areas.
It sounds strict because it saves time. When teams lock these pieces early, every tactic flows faster and the SEO timeline holds up.
How I structure a B2B SEO system
I run the program as a system. Each part does a specific job and feeds the next.
-
Demand and keyword mapping to personas and stages
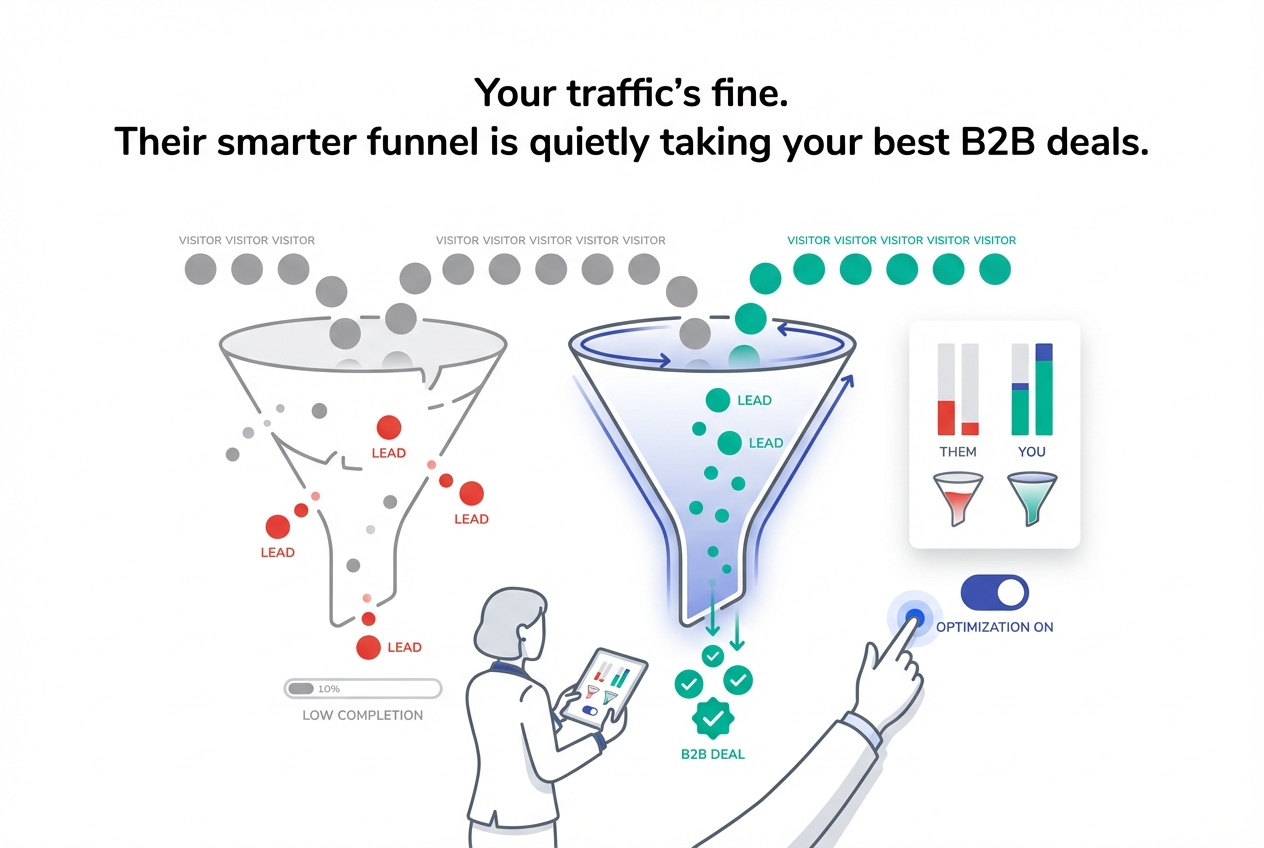
I start with intent, not just volume. I map topics to jobs buyers need done, split by stage: problem, solution, vendor, and deal support. I use keyword tools and Search Console to confirm queries and validate with sales call notes. If sales keeps hearing the same three objections, I write three bottom‑of‑funnel pages - not another generic guide.
-
Technical SEO for B2B
- Crawl and indexation: fix redirect chains, canonicals, and blocked resources; confirm bots see what matters.
- Site architecture: tighten internal links from best‑performing posts to service and comparison pages.
- Core Web Vitals: focus on CLS and LCP for service templates and the blog.
- Log files and sitemaps: verify crawl focus; remove staging leftovers and thin filters.
- Structured data: organization, article, FAQ, and appropriate service schema.
- Internationalization: keep URL patterns simple; add language folders only when justified.
-
Bottom‑of‑funnel content
Service pages should say who it’s for, how you work, outcomes, proof, and next steps. Comparison pages that address “you vs another approach” often outperform vendor‑vs‑vendor pieces. I add use cases, ROI stories, architecture diagrams, and integration walkthroughs. Case studies belong here and should read like narratives with metrics, not press releases.
-
Authority building
Digital PR, expert quotes, and helpful assets bring coverage and links. Partner listings, integration pages, and analyst citations add trust. I publish thoughtful takes on LinkedIn with data and link back to relevant pages. I repurpose webinar clips into short articles that answer specific search questions and cite them in outreach.
-
Conversion architecture
I make forms obvious but not pushy. Short demos or screen recordings show rather than tell. Chat routes questions to the right team. I enforce speedy response SLAs. Each conversion maps to a clear thank you page and event. If multiple industries are served, I route by segment and show relevant proof after submission.
-
SEO reporting
I measure clicks and qualified sessions - not just impressions. I track MQL to SQL lift, pipeline created, revenue, CAC, and payback. I blend GSC, GA4, and CRM data into one report. I share wins, misses, and the plan to fix them. A small contradiction is worth noting: some leaders want to front‑load top‑of‑funnel, yet bottom‑of‑funnel moves the needle first in services. I publish those early, then expand clusters so traffic quality rises with volume.
Research questions, KPIs, and decision gates
I write questions like a research study, pick metrics, and set windows.
Questions
- Is organic traffic quality improving faster than volume?
- Are SQLs and late‑stage opps from organic rising month over month?
- Does pipeline created from organic grow ~20 percent within 180 days?
- Are CAC and payback improving as organic’s share of opps increases?
Hypotheses and thresholds
- Qualified organic sessions up ~30 percent by day 180, with bounce rate and time on page trending the right way.
- SQLs from organic double within 180 days for targeted services.
- Pipeline from organic up 25 to 50 percent by day 365.
- CAC drops 20 to 40 percent by day 365 as organic share rises.
- Payback within 6 to 12 months at the channel level.
Measurement windows and sources
- 30 to 90 days: ranking lift for priority terms, index fixes, and first conversions from revised pages.
- 90 to 180 days: SQL lift, first opps influenced by new pages, early revenue from shorter cycles.
- 365 days: meaningful share of new pipeline from organic and a clear CAC shift.
- Sources: GSC for query/page movement; GA4 for sessions and conversions (direct and assisted); CRM for opp creation, revenue, and stage velocity.
Decision logic
- If SQLs from organic are flat by day 120, I shift content toward comparison and late‑stage assets.
- If rankings stall, I allocate more lift to internal links and PR rather than adding more posts at the same depth.
What recent scenarios taught me
Two anonymized composites reflect common B2B service patterns. Your mileage will vary by category, deal size, and cycles.
Case A: Mid‑market consultancy focused on integration services
- Baseline: 16 qualified organic demos/month; CAC $2,400 blended; no comparison pages.
- Day 90: sitewide technical fixes; three refreshed service pages; two comparison pages live. Qualified demos up to 26. Three terms moved from average position 14 to 6.
- Day 180: six use case pages and one deep case story with numbers. SQLs from organic up 78 percent vs baseline. Two new opps created with above‑median deal sizes. CAC trending to $1,800 as organic share rises.
- Day 365: five PR placements and consistent internal links across clusters. Organic drives 31 percent of new opps (up from 12 percent). CAC lands at $1,350. Payback near eight months.
What worked
- Early focus on bottom‑of‑funnel pages that matched how buyers compare approaches.
- Tight internal links from older high‑traffic posts to new service content.
- PR that earned links to the right URLs, not only the homepage.
What didn’t
- An “ultimate guide” shipped too early. It drove views, not SQLs. I postponed that until core pages stabilized.
Case B: Specialist IT provider targeting regulated industries
- Baseline: 4 organic opps per quarter; long cycle; heavy compliance questions.
- Day 90: Core Web Vitals improved on service templates; FAQs structured with schema; locations marked up. Early lift in impressions and a few high‑intent forms.
- Day 180: a seven‑page compliance series and two short architecture explainers. SQLs from organic doubled; average time on those pages topped three minutes.
- Day 365: keyword set expanded to include “framework mapping” and “integration checklists” tied to the compliance theme. Organic opps grew to 15 per quarter. CAC down ~35 percent; faster stage movement from better pre‑sale education.
What worked
- Narrow focus on one theme where the brand had true depth.
- Schema for FAQs and service details that surfaced rich results.
- Coordination with sales so content addressed real deal blockers.
What didn’t
- A slow dev queue delayed fixes. I shipped two pages on a lightweight stand‑in, then merged later to avoid losing momentum.
Result patterns I watch
- Cohort charts for pages launched in the same month show similar growth curves, which boosts confidence in the plan.
- SERP movement tables provide a weekly pulse. When a cluster sits at positions 8–12 for two weeks, I assign link building and on‑page lift in the next sprint.
Threats to validity and how I hedge
SEO doesn’t live in a lab. Several risks can cloud results if I don’t plan for them.
- Attribution gaps: missed UTMs or broken auto‑tagging can hide organic influence. I run analytics audits quarterly and keep an annotation log for major releases, PR hits, and site changes.
- Sales cycle length: long cycles blur signal. I use leading indicators like demo completion rates and content‑assisted stage movement until revenue catches up.
- Seasonality: many industries slow in Q4 or summer. I compare year over year and use publish‑month cohorts.
- Limited content velocity: quality wins, but pace still matters. If shipping stalls, I focus on pages closest to revenue and improve internal links.
- Dev constraints: when the queue blocks technical work, I tackle content, internal links, and schema; for heavier items, I quantify impact and secure buy‑in.
- SERP volatility: updates and AI overviews change clicks. I hedge with email capture, strong brand queries, and pages that answer questions clearly. I monitor how AI summaries cite sources and structure pages to be quotable.
Quality assurance that preserves inference
- Analytics audits: verify goals, events, and UTM rules; keep source/medium consistent across GA4 and CRM.
- Data hygiene: dedupe CRM records, standardize campaign names, and require sales‑useful fields on forms.
- Experiment design: set a control group of legacy pages; apply new link structures to a subset; monitor relative lift.
- Content QA: enforce editorial guidelines, SME review, and truth checks on statistics; link to original research where possible.
- Release notes: log technical changes, launches, and PR hits; correlate traffic and ranking shifts to real events.
How I evaluate potential partners and roadmaps
When I evaluate partners or internal roadmaps, I judge by ownership and clarity. B2B SEO for service companies demands a plan that respects stages, cycles, and how decisions actually get made. The math should be plain: SQLs rise first, then opps, then revenue, while CAC drops. The timeline should be realistic: quick wins in 30–90 days, visible pipeline impact by 90–180 days, and durable scale inside a year.
What I expect to see
- A named owner for technical work, content, PR, and reporting.
- A monthly readout that blends GSC, GA4, and CRM with commentary on wins and misses.
- A rolling 90‑day roadmap: page launches, internal links, PR targets, and experiments.
- Decision gates tied to research questions: if SQLs or opps miss mid‑cycle targets, shift focus rather than adding more of the same.
Signals that tend to predict success
- A process that maps intent to revenue, not only traffic.
- Technical capability with logs, sitemaps, and Core Web Vitals fixes.
- Editorial muscle for bottom‑of‑funnel assets that sound like the sales team.
- Real PR execution that lands relevant links.
- Tool fluency across analytics, search, and CRM.
- A reporting rhythm that tells a simple story and owns the downside.
One last note on trends: AI overviews, privacy shifts, and zero‑click results are reshaping the click map. Pages that win answer the exact question, carry proof, and speak to risk. The rest is consistency. If I keep measurement honest and the plan focused, organic search becomes a steady source of qualified demand rather than a hope‑and‑wait channel. The path isn’t flashy, and that’s the point: pick high‑intent pages first, fix crawl issues, publish proof, earn links that matter, and report with candor. Over a year, that steady system turns into a durable advantage for a B2B service brand that wants growth without runaway CAC.


.svg)

.svg)
.svg)