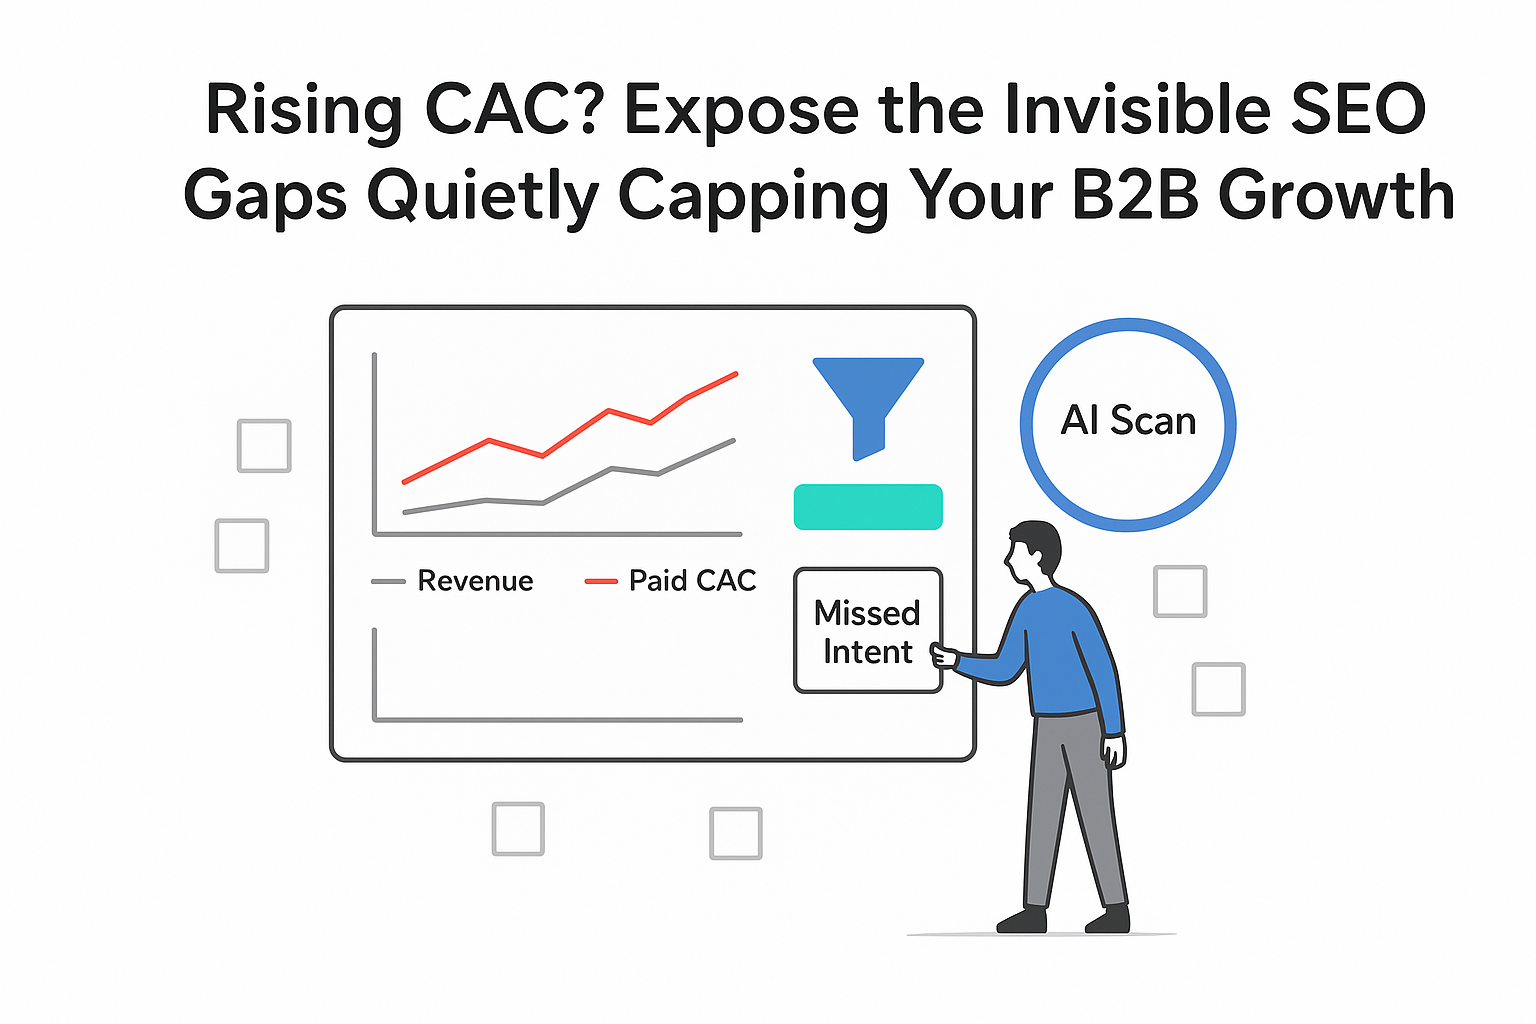
I want the truth on SEO, not fluff. If I run a B2B service company, I care about a simple scoreboard that tells me whether organic search is pulling its weight. That is the point of a B2B SEO dashboard: one screen, one story. Does search fill my pipeline with the right deals, at the right cost, in the right timeframe? If the answer is yes, I scale with confidence. If not, I fix it before the month slips away.
What a B2B SEO dashboard must show
I open on the one-screen view leaders actually use. Think pipeline, revenue, and cost efficiency from organic search. No long scrolling. No mystery widgets. Everything maps cleanly from MQL to SQL to Opportunity to Closed-Won, with counts, rates, and dollar values visible at a glance.
Here are the tiles that matter:
- Organic pipeline value
- Closed-won revenue from SEO
- ACV from organic
- Win rate for SEO-sourced deals
- Sales cycle length in days
- MQL to SQL rate
- SQL to Opportunity rate
- Cost per opportunity from SEO
- Assisted conversions from SEO content
I map traffic and non-brand click data from analytics and search platforms, and I pull MQLs, SQLs, opportunities, and revenue from the CRM. I keep source definitions consistent (for example, Channel or Source equals Organic Search), and I make sure UTMs and default channel groupings match those rules. When I connect these pieces, the dashboard moves beyond visits and shows business impact.
SEO can feel slow. It is slower than paid in many B2B cycles. Still, I surface early indicators that tie to later revenue: qualified non-brand click growth, high-intent keyword movement, and content-assisted opportunities. They live in the same snapshot so I can see signal before the quarter closes.
Why this matters to leadership
A clear B2B SEO dashboard does four things that matter to a CEO and a sales leader:
- Holds marketing accountable to revenue and pipeline, not vanity metrics
- Speeds decisions with live data leaders can trust
- Cuts reporting time so teams spend more time fixing and building
- Keeps marketing and sales working from the same scoreboard
The deeper cut is where alignment happens. When I show pipeline by landing page group, the content team stops guessing. When win rate by source is visible, finance can sanity-check CAC from organic against paid. When sales cycle length for SEO is trending down, I know messaging and qualification improved. The dashboard becomes a shared artifact that reduces friction and finger-pointing. It turns "I think" into "here is what happened and why."
Communicating with executives
I keep presentation simple and consistent. A weekly at-a-glance executive summary works. I use green or red deltas against targets and last period, plus one short narrative line that ties movement to actions.
Examples:
- Pipeline value from organic: 2.6M, up 14% vs target. Note: Two solution pages moved into top 5 for high-intent terms; four strong links added to the pricing guide.
- Closed-won revenue from SEO: 410K, down 9% vs last quarter. Note: Fewer late-stage deals in July; sales cycle elevated at 67 days. New case study launched to support late-stage proof.
- Non-brand clicks: up 22% month over month. Note: Consolidated thin blog posts; improved internal links to comparison pages.
I set alerting thresholds, not just reports. I flag drops in organic pipeline value of 20% week over week, sudden declines in indexation, or Core Web Vitals failures on top revenue pages. I use built-in insights, alerts, or anomaly detection in analytics, search, or BI platforms so most days are calm and only real issues get loud.
KPIs that drive decisions
I group metrics into three tiers so every number has a job. Each KPI should answer a decision question, not just decorate a chart.
Outcome metrics
- Revenue from organic: Did search drive dollars, not just traffic
- Pipeline value from organic: Is there enough potential to hit quota next quarter
- Opportunities sourced by SEO: Are qualified deals entering the funnel
- ACV from organic: Are the right accounts showing up
- Win rate for SEO-sourced deals: Does intent match fit
- CAC from organic: Is SEO cheaper than paid at comparable quality
Leading indicators
- Qualified organic sessions: Is the right audience arriving, not just more users
- Non-brand clicks: Are we capturing intent beyond the brand name
- High-intent keyword rankings: Are solution, category, and comparison terms moving up
- Demo-form conversion rate on organic traffic: Are visits turning into leads
- Content-assisted opportunities: Which articles or pages show up in journeys that become deals
Health signals
- Index coverage and indexation rate: Are revenue pages discoverable
- Core Web Vitals pass rate: Will users stay long enough to convert
- Crawl errors and blocked pages: Are bots hitting dead ends
- Structured data validity: Are richer search features available where relevant
- Internal linking to revenue pages: Are top pages easy to reach
Attribution matters. In long B2B cycles, I prefer data-driven or position-based models when available. Touchpoints stack up over months, so I set lookback windows of 90 to 180 days. Short windows understate SEO's role and distort planning.
Organic pipeline and attribution
I start with the CRM. I pull MQLs, SQLs, Opportunities, Pipeline value, Closed-won revenue, and Sales cycle length. I segment everything by channel equals Organic Search using consistent UTMs, then enrich by landing page group and persona if available. I include stage conversion rates - MQL to SQL, SQL to Opportunity, and Opportunity to Closed-Won - so I can spot where friction lives.
Useful tiles leaders actually use:
- Pipeline value from organic, by landing page type: solution pages, pricing, competitor comparisons, blog guides
- Opportunities sourced by organic, by persona or industry
- Sales cycle length for SEO deals, by cohort month
- Win rate for SEO-sourced opportunities, by product line
- Cost per opportunity from organic: total SEO spend divided by SEO-sourced opportunities
I do not stop at last click. I include multi-touch assisted opportunities and attribute value to pages that start or influence the journey - like the guide someone reads before returning direct to book a demo. Even a simple position-based approach makes the picture more truthful.
Technical signals that affect revenue
Technical work deserves a seat on the dashboard, but only the signals that affect money belong on the executive layer. The question is simple: can search engines reach, understand, and rank the pages that sell - and do users get a fast, stable experience?
Key health tiles:
- Indexation rate for money pages: percentage of solution and pricing pages indexed
- Pages with errors: 404s, 5xx, soft 404s, and blocked pages
- Core Web Vitals pass rate at p75: LCP, CLS, and INP on logged pages
- Page speed at p75 by template: solution and pricing templates first
- Crawl budget waste: share of bot hits on non-200s and faceted URLs
- Structured data validity: product or FAQ markup where relevant, with error counts
- XML sitemap freshness and coverage: are new pages included and updated
- Canonical conflicts on key pages: duplicates or wrong canonicals
- Internal linking depth to revenue pages: clicks from home to important pages
I translate each metric to a business outcome. Core Web Vitals influence conversion rate and engagement; indexation affects discoverability and keyword coverage; internal linking can move rankings for high-value pages. I add a simple estimated impact note tied to pipeline, for example: "Raising the pass rate on pricing pages from 50% to 90% correlated with a three-point gain in demo CVR in last quarter's cohorts."
Cross-channel views that keep SEO in context
Sometimes I need more than an SEO-only view. Cross-channel dashboards keep everyone grounded in shared reality and show how organic influences, and is influenced by, the rest of the mix:
- CMO dashboard: pipeline and revenue by channel, blended CAC, and channel share of pipeline
- Digital performance dashboard: non-brand traffic, paid spend, assisted conversions by content group, and cross-channel ROAS vs pipeline value
- Web analytics dashboards: key events, demo submissions, scroll depth on important pages, and organic demo CVR by landing page group
- Social dashboards: social-assisted opportunities, referral sessions to solution pages, and top-of-funnel content nudging audiences toward high-intent pages
- Paid search dashboard: paid search opportunities next to SEO-sourced opportunities for the same keyword themes, with blended CAC
- Project management dashboard: content production status mapped to keyword groups and the related pipeline tile so shipping work links to forecasted impact
- Email dashboard: organic-to-email journey counts, email-assisted opportunities, and newsletter-driven return visits to solution pages
- A/B test dashboard: SEO-traffic cohorts exposed to on-page tests, demo CVR changes, and revenue impact estimates with test status
Each view includes at least one tile that loops back to organic pipeline value or assisted opportunities. Search never sits in a silo, and paid never carries the ROI story alone.
How I build and maintain the dashboard
Step 1. Define goals and SLAs
I agree on targets for pipeline value from organic, revenue from organic, win rate, and sales cycle length. I set target demo-form conversion rates for organic traffic. I write the rules for what counts as SEO-sourced versus SEO-assisted and assign ownership to each KPI. Without this, the dashboard becomes a scoreboard without a league.
Step 2. Unify data sources
I connect analytics for sessions and events, search performance for impressions and non-brand clicks, the CRM for stages and revenue, and rank tracking for keyword positions. I standardize channel definitions and UTMs before pulling data. If I use a data warehouse or BI connectors, I document the rules in a shared spec and keep fields consistent (for example: channel equals Organic Search; source equals Organic; utm_medium equals organic).
Step 3. Build the executive layer first
I start with the summary row: pipeline value from organic, closed-won revenue from SEO, ACV, win rate, cycle length, and CAC from organic. I add a second row with stage conversion rates, non-brand clicks, and demo CVR. I keep trendlines for 90 and 180 days because B2B cycles are longer. Only then do I create drilldowns for content, keywords, and technical health - each tied to money pages and high-intent themes.
Step 4. QA and alerting
I validate that the numbers match the CRM. I pick a week and reconcile counts for MQLs, SQLs, Opportunities, and Closed-Won by source. If the dashboard and the CRM disagree, I fix mapping before release. I set anomaly alerts for drops in non-brand clicks, indexation, or pipeline value, and I add owner names next to each alert so action is clear when a signal fires.
A final word on culture. Dashboards do not fix strategy by themselves. They nudge behavior. When a content team can track its work to pipeline, writing shifts toward decision-making pages. When sales sees opportunity counts rising from organic, calls improve for that intent. When finance sees CAC from organic steady while paid rises, budgets stay balanced. The dashboard encourages small, steady shifts that add up.
SEO rarely delivers instant wins in B2B. Fast feedback is still possible. The trick is combining leading indicators with revenue outcomes in one place. I see non-brand clicks grow, form rates improve, rankings move - then pipeline lifts. It is not instant, but it is visible, and it gives me control. That is what a good B2B SEO dashboard delivers, day in and day out.


.svg)