
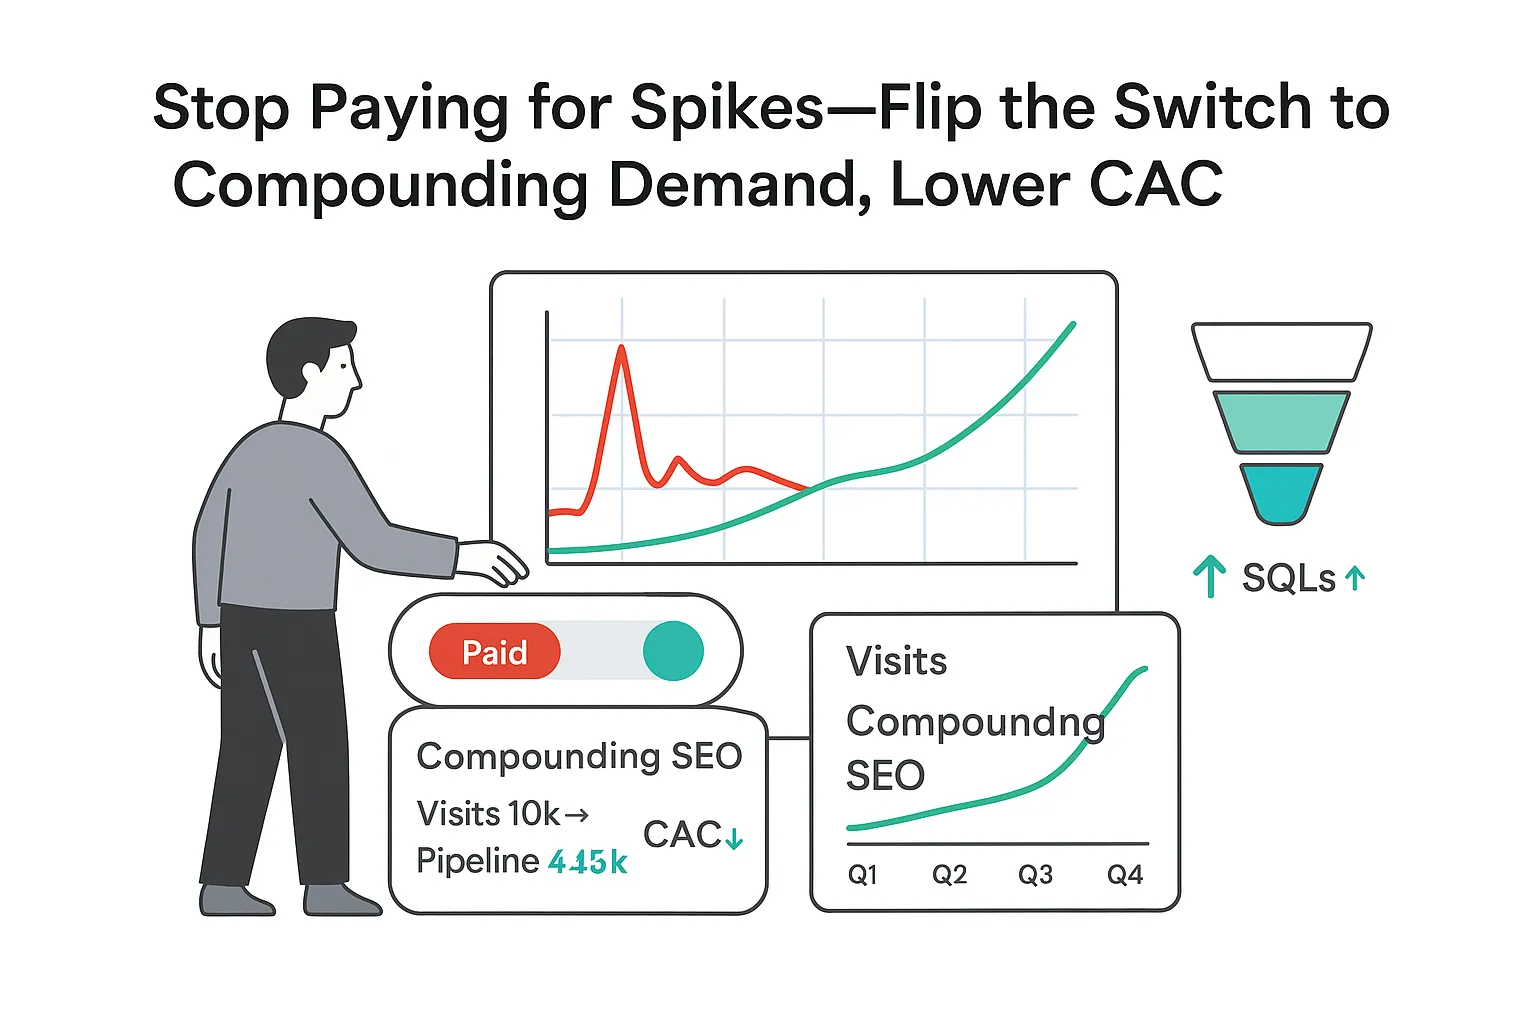
If you run a B2B service company, you already know paid can spike leads fast but plateaus just as quickly. Then the budget creeps up, the pipeline gets jumpy, and your team ends up chasing forms that never turn into revenue. B2B SEO solves a different problem. It builds compounding demand and sends sales-ready traffic to the right pages, month after month, without an always-rising ad bill. The trick is doing it with accountability, math, and a clear runway to SQLs and revenue.
Why B2B SEO Builds a Floor You Can Stand On
Here is the simple story busy CEOs want to see: predictable pipeline, lower customer acquisition cost, and bigger deal sizes because the right buyers find you at the moment they are evaluating options. I anchor B2B SEO outcomes to the revenue funnel, not vanity graphs.
Example metric flow (illustrative - calibrate with your own baselines):
- Traffic to MQL: 10,000 organic visits at 2.5% visit-to-MQL yields about 250 MQLs.
- MQL to SQL: At 35%, that’s roughly 87 SQLs.
- SQL to revenue: With a 25% close rate and a $20,000 average contract value (ACV), that’s about $435,000 in booked revenue.
Planning horizon:
- Expect quick wins in 3–6 months and compounding growth in months 9–12 as authority and topical coverage build.
What typically shifts when SEO is focused and tied to revenue:
- Pipeline reliability: Organic SQLs often rise 30–60% within two quarters in service markets when foundations are solid. Fewer slow weeks. Less executive whiplash.
- Lower CAC: As pages rank and keep working, organic CAC tends to drop materially over 12 months while ad auctions get pricier.
- Larger deals: Buyers who search pain terms and comparison pages are usually later stage. Deals close faster and at higher ACV.
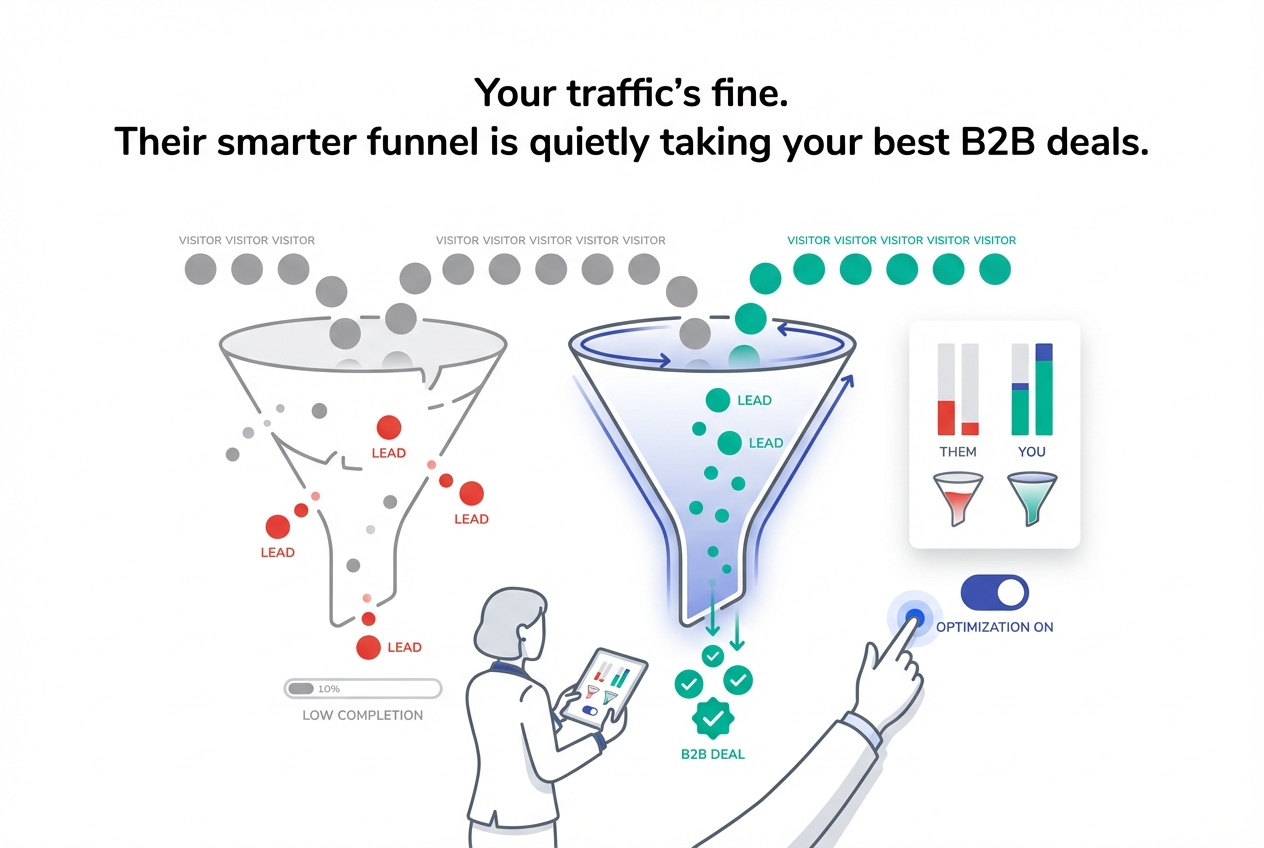
- Better sales efficiency: Pages pre-qualify buyers. Fewer bad fits. Sales spends time with intent-rich conversations.
- Attribution that holds up: Connect analytics and CRM so every visit, MQL, SQL, and dollar has a source and a reason.
You still need paid for testing and surge campaigns. Yet the point stands: SEO creates a durable floor you can stand on when budgets flex.
Turn Search Into Qualified B2B Leads
Strong SEO starts with ICP pains and bottom-of-funnel intent. Not all clicks are equal. I build pages that answer clear buyer intent such as “managed IT services for healthcare,” “SOC 2 compliance audit firm,” or “SOC 2 vs ISO 27001 comparison.” That’s how SEO converts search into a steady stream of qualified leads.
Examples of transactional keywords and typical SQL rates I see across service firms (ranges vary by segment and brand strength):
- “Managed IT services for healthcare”: 30–45% MQL-to-SQL when pages include pricing guidance, compliance proof, and case studies.
- “HR outsourcing for startups”: 25–35% with clear scope, SLAs, and an onboarding process.
- “Salesforce consulting partner near me”: 40–55% when location signals, certifications, and implementation notes are present.
Tie content to real pain and proof:
- Use internal links to prioritize service pages and proof pages to guide buyers through the funnel.
- Put outcomes, credentials, and short implementation notes near forms so later-stage buyers can validate quickly.
A quick example:
- A managed services provider targeting healthcare added three pain-point pages and two comparison pages. The result was about +22 SQLs per month by month five, with five closed in quarter two. The lift came from ranking for late-stage queries and making proof easy to find.
How Organic Lowers CAC Over Time
Paid CAC is arithmetic. Organic CAC is amortized content equity. Here’s a simple model to make the math tangible.
Illustrative breakeven model:
- Content investment: $15,000 in month one for research, writing, design, and technical work; then $6,000 per month for new pages and links.
- Conversion math: 8,000 visits at 2.5% to MQL yields 200 MQLs. At 35% to SQL, that’s 70 SQLs. With a 25% close rate and $20,000 ACV, that’s roughly 18 deals and $360,000 in revenue for the period being measured.
- Organic CAC at month six: Spend ≈$45,000 over six months; with ~18 closed-won deals attributed to organic in that period, CAC is ≈$2,500 per deal. As pages keep ranking and conversion efficiency improves, CAC continues to decline over the next two quarters.
Paid CAC comparison (illustrative):
- At $40 per click and a 3% landing page conversion rate, cost per MQL is about $1,333. With 30% MQL-to-SQL and 25% close, CAC would exceed $17,000 without strong brand search or retargeting. With lower CPCs and higher conversion rates, you can compress that, but organic usually wins on cost as volume compounds.
Twelve-month payback picture:
- Months 1–3: High spend, modest return, CAC looks heavy.
- Months 4–6: Rankings stabilize, CAC slides down (e.g., toward ~$2,500).
- Months 7–12: Content compounds. CAC can fall into the $1,200–$1,800 range while qualified volume rises.
What B2B SEO Is - and Isn’t
B2B SEO for service firms means earning qualified visibility for offers with longer sales cycles, buyer committees, and a smaller pool of ideal accounts. It isn’t retail search and it isn’t a one-click checkout. It’s trust, proof, and clarity for a team that wants to pick you and justify the choice.
Key differences from consumer search:
- Intent is deeper and slower: The same visitor may return five or more times before booking a call.
- Buyers compare providers, not colors: Pages must show approach, scope, timeline, pricing logic, and proof.
- Fewer keywords matter: Ten right pages beat a hundred broad posts that never convert.
Core stack I recommend for B2B SEO:
- Technical foundation: Crawl health, page speed, index control, structured data, and a clean site architecture that maps to your ICP and offers.
- Demand-led content: Topic clusters around service lines. Pain pages, solution pages, comparison pages, case studies, and implementation guides that remove fear and reduce perceived risk.
- Authority and links: Earn coverage with useful data, expert commentary, and partnerships that make sense for your industry.
- Conversion pathways: Clear next steps that fit B2B, pricing guidance or ranges, social proof, and outcomes near forms.
- Analytics and attribution: End-to-end tracking from query to revenue so you can show contribution by source.
Common Gaps and a Quick Diagnostic
Skipping or winging SEO has a cost. You lose visibility to competitors. Your pipeline swings from feast to famine. Pages rank for the wrong terms. Reports look busy but don’t tie to bookings. A clean feedback loop from search to sales fixes that.
Questions I use to diagnose issues fast:
- Do you rank top five for primary service terms in core regions?
- Is at least 30% of organic traffic landing on bottom-of-funnel pages?
- Can you show MQL → SQL → revenue by source in one view?
- Are sales saying leads lack fit or are “just researching”?
- If ads paused this week, would inbound lead volume fall by half?
If two or more hit a nerve, the gap is usually strategy or technical debt, not effort.
Use Paid Without Creating a Lead Cliff
Paid is great for testing messages and kicking off new markets. But CPCs keep rising and auctions are noisy. Many teams find that a pause in ads creates a lead cliff. A blended model works better: use paid to validate angles and collect query data, then let SEO build the durable pages that rank, convert, and lower CAC over time. Paid and organic should share insights; organic holds the floor.
A small scenario:
- Ads paused for two weeks. Demo requests drop 60%, and the pipeline dries up the next month. With a strong organic base, that same pause might drop only ~15% - painful but manageable.
A Five-Step Framework I Rely On
This mirrors how modern teams use automation, collaboration, measurement, and clear implementation to move fast without losing quality.
-
Research and strategy
- Map ICPs, demand, and SERPs. Tie keyword sets to buying stages, pains, and regions. Set a 12-week plan with traffic, MQL, and SQL targets. Produce an opportunity model, gap analysis, page map, and forecast that roll up to revenue.
-
Technical fixes
- Resolve crawl issues, slow templates, thin pages, and messy redirects. Add structured data for services, FAQs, and reviews. Monitor page experience. Keep a change log and baseline-to-after snapshots so impact is visible.
-
Content engine
- Build programmatic topic clusters for each service line. Use SME workflows so experts review instead of writing from scratch. Ship two to four bottom-of-funnel pages per month, two to three pain or comparison pages, and one proof asset. Maintain a style guide for consistent voice.
-
Authority and links
- Pursue relevant coverage with industry publications and partners. Publish data pieces and practical insights that people want to cite. Keep anchor text and target pages natural and goal-aligned.
-
Revenue analytics
- Attribute pipeline to source, not just sessions. Maintain a simple scorecard covering traffic, rankings, MQLs, SQLs, influenced revenue, and CAC trend. Trigger alerts when priority pages move or key terms slip.
Cadence that sustains momentum:
- Weekly: Ship list, blockers, and quick wins.
- Monthly: Review with sales - pipeline quality notes, friction points, next month’s plan.
- Quarterly: New clusters, new regions, bigger goals.
Final Words
B2B SEO fits leaders who want scale without chaos. You get a more predictable inbound engine, cleaner attribution, and lower CAC when the work stays tied to outcomes. Keep it short, clear, and measurable from the C-suite to the sales floor. The work is steady rather than flashy, and that is exactly why it wins.
Frequently Asked Questions
What timeline should I expect for SEO results?
Early movement typically shows in 60–90 days as technical fixes land and first pages index. Meaningful pipeline impact usually appears in 3–6 months when bottom-of-funnel pages settle on page one. Growth compounds at 9–12 months as clusters and links stack. Ship something every week to keep the snowball rolling.
How do I calculate SEO ROI?
Use a simple model: traffic × visit-to-MQL rate × MQL-to-SQL rate × close rate × ACV minus content and link costs. Example: 12,000 visits at 2.5% yields 300 MQLs. At 35% to SQL, that’s 105 SQLs. At 25% closed and $20,000 ACV, that’s ~$525,000 revenue. Subtract $20,000–$30,000 in costs for the period to estimate net ROI. Adjust each assumption to your historical data.
What should I look for in a B2B SEO partner?
I look for direct B2B service-market experience, clear technical depth, and an operating model that turns SMEs into rapid approvals. I also expect end-to-end attribution to SQL and revenue. Above all, prioritize accountability to outcomes and a weekly scorecard over slideware.
How can small B2B companies keep SEO cost-effective?
Start with bottom-of-funnel pages for your top two services and core regions. Fix technical debt that blocks indexing and speed. Build one or two tight clusters around your best-margin work. Pair with targeted digital PR that earns a handful of quality links.
What tactics reliably increase organic traffic that converts in B2B?
Build topic clusters around each service line. Add pain-point and comparison pages buyers actually search. Publish case studies with outcomes and short implementation notes. Include expert quotes for credibility and internal links that guide readers from learn to choose. Use your query data to spot pages that deserve their own home.


.svg)

.svg)
.svg)