
I work with B2B service teams that care about straight lines between spend and pipeline. Paid search feels fast but pricey. Organic feels slower but safer. Both can work; their payoffs just run on different clocks. My aim is to build an SEO program that compounds, plugs cleanly into the sales cycle, and proves its keep with numbers a CFO actually likes.
What I Know About SEO ROI
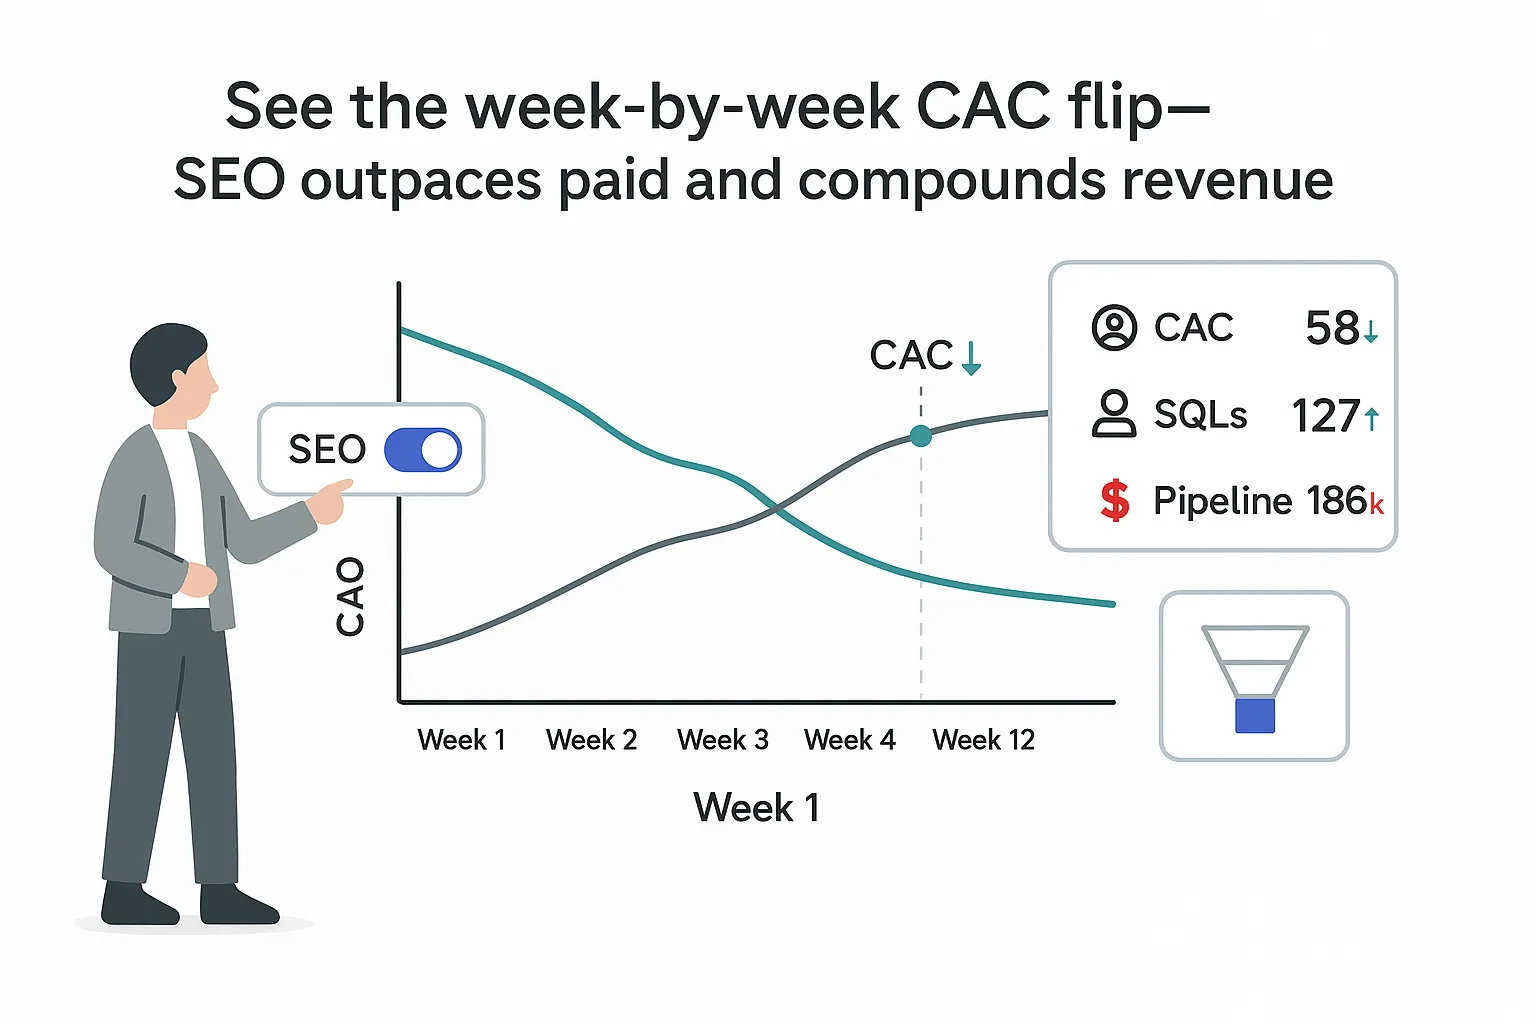
Across B2B services, I regularly see paid search CAC land 1.5 to 3 times higher than SEO-attributed CAC once an organic program matures. That gap widens in categories with high CPCs and long buying cycles and narrows in tiny niches with limited search volume. Ranges vary by market, but this pattern is directionally consistent with published CPC and SEO ROI benchmarks from independent industry reports. What matters is modeling CAC apples-to-apples: I include content production, development, analytics, and headcount on the organic side so the comparison is fair.
Timelines matter even more:
- 0 to 30 days: indexing, technical fixes, and first keyword baselines. Some pages jump quickly, but that’s the exception.
- 30 to 90 days: early ranking lifts for long-tails, first non-brand traffic, and new assisted conversions show up in analytics.
- 90 to 180 days: service pages and hubs begin to rank on mid-tier terms; first SQLs tied to organic for many firms; demo or consultation requests from search rise.
- 180 to 365 days: compounding effects kick in, internal links mature, brand queries creep up, and organic CAC often settles well below paid.
Payback windows vary by market difficulty and content velocity, but a practical frame holds:
- 90-day payback if authority and technical health are in place and a content backlog is ready to publish.
- 180-day payback for most mid-competition B2B services with steady shipping and clean tracking.
- 365-day payback in tougher markets or for thin domains.
Payback and Attribution in the Real World
B2B sales cycles blur attribution. An engineer reads a comparison page in March, attends a webinar in April, clicks a branded ad in May, then signs in July. Last click awards the win to paid. Yet the content set the table. When I pair assisted conversion views in analytics with path analysis in a BI layer and opportunity-source checks in a CRM, organic’s influence typically lands 1.5 to 2.5 times higher than last click suggests. Two setup notes keep this honest:
- Use consistent lookback windows per funnel stage (e.g., longer for BOFU).
- Tie content to opportunities, not just sessions: I store page IDs on forms, log first-touch and assist, and reconcile against opportunity creation.
Visual: a simple timeline from day 0 to day 365, marking indexing, first ranking lifts, first SQLs, and CAC crossover with a rising organic line and a flat paid CAC line.
What Wins in B2B Search Right Now
- Helpful content still matters. Google removed a single “Helpful Content” classifier, but sitewide quality signals remain. Thin, unfocused pages hold a site back; expertise, clear purpose, and user-first formatting still move the needle.
- E-E-A-T is practical, not poetry. I show real authors with credentials, cite sources, publish dated case studies, and add proof (e.g., review schema). The bar is higher in sensitive categories, but the pattern helps everywhere.
- AI Overviews are a new front door to commerce and zero-click results change click flows - heavy reliance on answers reduces clicks. If a summary covers the basics, my page must offer the next step a buyer needs - detailed specs, pricing context, implementation notes, or a unique framework.
- Context wins. Pages inside strong topical hubs rise faster than lone posts. Surround commercial pages with related guides, decision aids, and success stories. Fit often beats brand size.
- Ads and organic feed each other. Copy that speaks in clear, practical language (think pricing ranges, SLAs, feature caps) informs both paid creative and organic pages - and is more likely to be quoted by AI systems that reproduce ad-derived language and reward clarity over fluff when your ads go beyond flashy language.
Waiting carries risk. Competitors who publish steady, technically sound content now set a higher bar in six months. Because SEO compounds, late starters must outpace them just to catch up.
The 90-Day Operating Model I Use
I keep the plan on one screen, assign a single accountable owner, and run on a weekly drumbeat.
Phase 1: Discovery (weeks 1-2)
- Inputs: analytics and search performance data, CRM opportunity history, win-loss notes, sales call recordings, CMS access, and a full site crawl.
- Outputs: prioritized technical issues by impact, rankings baseline, content inventory with performance tiers, ICP and jobs-to-be-done mapped to intents, and a 90-day backlog of pages and refreshes.
Phase 2: Strategy (weeks 2-3)
- Draft a keyword map by funnel stage and service line. Pair each target term with one primary page.
- Define page types to capture demand first: service, industry, comparison, case study. Then plan demand-creation pieces like POV essays and frameworks.
- Internal linking: every new page links to a parent hub and two siblings; older pages are updated to link back.
Phase 3: Execution (weeks 3-12)
- Fix technical issues in parallel with content shipping. Prioritize CWV and index control, then schema and URL cleanup.
- Ship content weekly. Aim for two to four pieces per week: one commercial page, one to two supporting articles, and one refresh.
- Sync with sales every other week to confirm message-market fit and surface objections to answer in content.
Phase 4: Measurement (weeks 1-12)
- One weekly scorecard with the same fields: crawl health, indexation, rankings by cluster, non-brand clicks, conversions, SQLs, and revenue influenced.
- A single owner is responsible. Not a committee. Others support, but one name carries outcomes.
Ownership model
- Sponsor: CEO or CRO sets targets and clears roadblocks.
- Accountable owner: Head of Marketing or Growth lead.
- Responsible: SEO lead, content lead, and dev lead.
- Consulted: Sales and CS leaders, subject-matter experts.
- Informed: Finance and ops.
Weekly scorecard rhythm
- Monday morning, 15 minutes, no slides. Trends, blockers, next five ships.
- Quarterly objectives, for example: rank top 5 for 10 money terms, publish 40 pages, and cut page load by 40% on key templates.
Visual: a simple RACI table with Sponsor, Owner, Responsible, Consulted, Informed columns, plus a one-page scorecard mock showing trend lines and a short backlog list.
Keyword, Content, and Technical Fundamentals
Keyword strategy
- Start with who buys, why they buy, and what they type when they’re confused, curious, or ready to shortlist. I pull language from three places: closed-won notes in the CRM (outcome words, not features), patterns from sales call recordings (objections and goals), and SERP features (People Also Ask, comparison carousels, review snippets).
- Map to TOFU, MOFU, BOFU clusters:
- TOFU: broad questions your ICP asks early (e.g., managed IT security risks for healthcare).
- MOFU: solution searches and problem framing (e.g., managed IT services pricing).
- BOFU: brand or comparison terms (e.g., managed IT services vs in-house IT, SLA examples).
- Example cluster, Managed IT services
- Parent terms: managed IT services, IT support services, MSP for healthcare.
- Modifiers: pricing, SLA, compliance, HIPAA, multi-site, 24/7 support.
- Supporting content: SLA checklist page, HIPAA guide, cost breakdown with ranges, a case study from a multi-site clinic, and a comparison page versus in-house IT.
- Internal link plan: each supporting piece links to the hub and the service page; the service page links back to top supporting guides and the case study; every case study links to its industry page and the core service.
- Visual: a cluster map with the service hub at the center, spokes to supporting guides and case studies, and arrows showing internal link directions.
Content strategy
- Demand capture first
- Service pages by line of service: clear value prop, who it’s for, outcomes, proof, FAQs, next step.
- Comparison pages: honest differences, pricing ranges, and SLA notes.
- Industry pages: sector needs, compliance notes, and sector-specific case studies.
- Case studies: problem, approach, results, time to value, with named roles and metrics.
- Demand creation next
- POVs that frame the market problem in your words, not platitudes.
- Frameworks sales can use live (e.g., a 5-part risk model for IT readiness).
- Templates and conversion paths
- Use consistent page templates with above-the-fold clarity, proof blocks, and simple inquiry paths. Sticky contact modules help without overwhelming.
- For TOFU, use soft next steps (e.g., calculators or frameworks) that connect to your CRM.
- For MOFU or BOFU, include scannable pricing context and a short form, plus an option to book a conversation if that fits your flow.
- Topical authority
- Build hubs around each service line. Each hub owns one main term and links to 10-20 related guides.
- Create briefs with target queries, questions to answer, internal links to place, subject expert input, and schema notes.
- Visual: a pillar-hub wireframe with callouts for headline, proof strip, FAQ block, and a right rail with sticky contact.
Technical SEO
- Information architecture
- Keep URLs clean and grouped by service and industry (e.g., site.com/services/managed-it and site.com/industries/healthcare).
- Keep slugs short, readable, and stable.
- Schema and on-page detail
- Organization, Website, Service, FAQ, and Review schema where applicable.
- Include named authors with credentials on guides. Add dates and update logs to signal freshness.
- CWV and crawl control
- Fix LCP and CLS on main templates, load critical CSS first, and lazy-load below-the-fold media.
- Submit XML sitemaps by section. Use robots to keep thin or duplicate pages out. Set canonicals on variants and pagination.
- Internal linking and localization
- Rules: each new page gets three internal links in and three out. Refresh older pages monthly to link to new content.
- For regions, set hreflang, localize currency and contact details, and adjust examples to local norms.
- Visual: a simple site tree with Services, Industries, Resources, and About branches, plus a code snippet showing Service schema with name, areaServed, and aggregateRating.
How I Measure Results and Forecast
What you track decides what you believe. I set leading and lagging indicators so I can course-correct early and still prove revenue later.
Leading indicators
- Crawl health: pages discovered, average crawl depth, blocked URLs.
- Indexation: submitted vs indexed, coverage errors trending down.
- Rankings: top 3 and top 10 counts by cluster, share of voice on money terms.
- On-site behavior: scroll depth and engagement on new pages, CWV scores.
Mid indicators
- Non-brand clicks and sessions, segmented by service line and region.
- Assisted conversions tied to organic; multi-touch paths that include organic.
- Form starts, chats, and call requests from organic.
Lagging indicators
- MQLs tied to organic, SQLs, opportunities created, pipeline value, and revenue from organic source or assist.
- CAC by channel, including content and dev costs on the organic side.
Sample dashboard
- Filters for channel, segment, and funnel stage; a rankings widget by hub; a shipping log; conversion rates by page type; and a pipeline widget showing opportunities from organic this quarter versus last.
- I pair that with a forecast tab that estimates future non-brand traffic and SQLs based on publication pace and win rates.
Forecasting model
- Inputs: current non-brand baseline, average CTR by rank, planned content per month, average time to rank for your site, and conversion rates. I use simple compounding gains per cluster and sanity-check against current impressions and top-of-page limits.
Realistic timelines by difficulty
- Low competition, healthy domain, steady shipping: first SQLs in 60-90 days, CAC crossover in 120-180 days.
- Mid competition or modest domain, consistent shipping: first SQLs in 90-150 days, CAC crossover in 180-270 days.
- Tough competition or brand new domain: first SQLs in 120-210 days, CAC crossover in 270-365 days.
Quantitative and qualitative learnings
- Expect variation by cluster. Some pages hit fast; others need links and time. Keep a monthly refresh cycle for underperformers.
- Read the pages that do win. They usually succeed because they solve a simple buyer task - show pricing ranges, provide an SLA template, or surface implementation dependencies. Copy that clarity across the site.
Visual: a dashboard mock with tabs for Traffic, Rankings, Conversions, and Pipeline, each with small trend charts and a filter bar for channel and funnel stage. In modern discovery, there’s no second page - first answers dominate.
In Short
- Prioritize: map ICP jobs to buying intents, start with demand-capture pages, and fix index blockers first.
- Produce: publish on a set schedule - one commercial page per week with supporting pieces, plus fast refreshes of winning posts.
- Prove: keep one scorecard, tie pages to opportunities in your CRM, and report both last click and assists.
- Scale: expand hubs by industry and use case, add languages or regions if needed, and keep internal links fresh.
If you worry SEO is slow, you’re right in month one - and that’s the point. It starts paying you back while paid keeps charging rent. An accountable program is simple at the surface: one owner, one scorecard, clear goals, steady shipping. Under the hood, it blends buyer research, useful content, and clean site health into a system that compounds. The sooner you start, the sooner compounding works in your favor - and the harder it becomes for late movers to catch you. Over time, the gap between paid CAC and SEO CAC widens, the pipeline becomes more resilient, and the team spends less time chasing clicks and more time closing work that fits.


.svg)

.svg)
.svg)