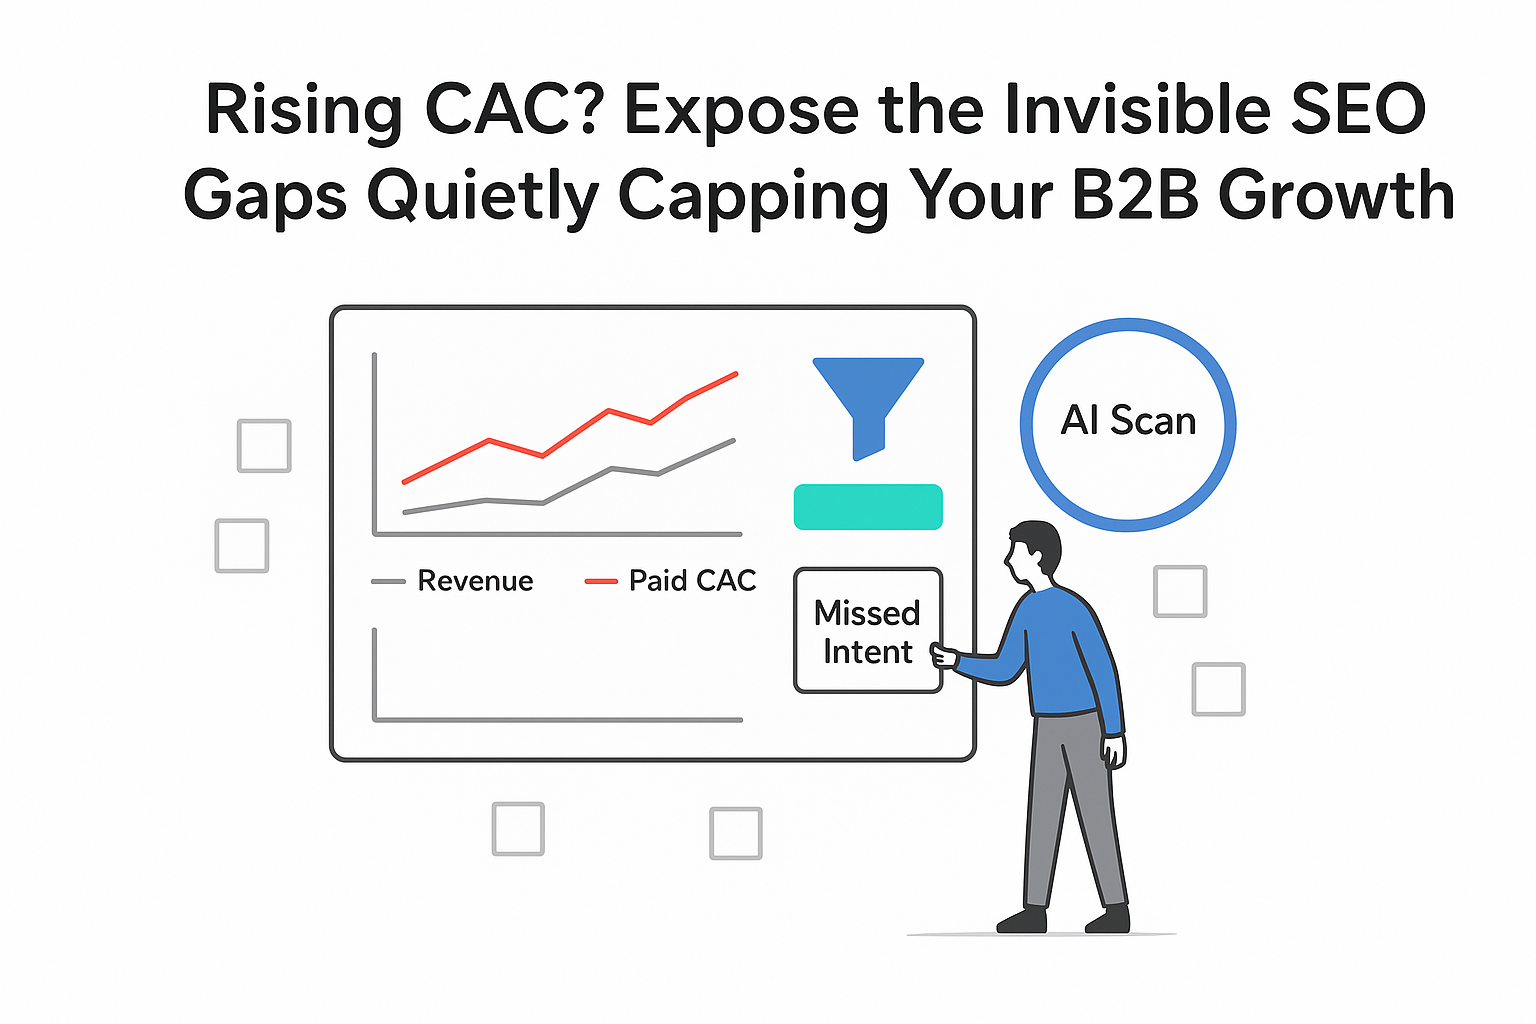
Updated: November 16, 2025. If you lead a B2B service company, you already know the fight for qualified pipeline is real. Paid keeps getting pricier. Referrals are lumpy. That is why I treat site speed optimization not as a technical checkbox but as a quiet growth lever that runs 24/7. It helps win visibility, earn trust faster, and turn visits into meetings. Speed is not everything, and it will not rescue weak positioning or irrelevant content, but it often decides who gets the first click and who gets the form fill.
Boost SEO rankings with site speed optimization
Google rewards fast, stable pages. That is not theory. Core Web Vitals are a ranking signal, and as of March 2024, Interaction to Next Paint (INP) replaced First Input Delay (FID) as the responsiveness metric. In plain terms, Google observes how quickly your biggest content appears (Largest Contentful Paint, or LCP), how stable the layout is during load (Cumulative Layout Shift, or CLS), and how responsive the page feels when a user interacts (INP). When I prioritize LCP under about 2.5 seconds on mobile and INP under roughly 200 milliseconds, I tend to see crawl efficiency improve, bounce rates ease, and user engagement signals lift - factors that can nudge rankings upward, especially on pages already in striking distance. Core Web Vitals alone will not outrank stronger content or better intent alignment, but shaving a second off a slow page can unlock impressions and clicks for queries where you already have relevance (see Google’s guidance on Core Web Vitals and INP updates on web.dev).
I make this practical by comparing field data before and after changes and annotating when LCP/INP fixes shipped. A simple trend view of impressions, average position, and Core Web Vitals over the last 90 days often makes correlations obvious without overpromising causation. Field data from real users matters most (e.g., CrUX data), while lab tools help isolate fixes. I pair both and keep the story simple: faster first paint, steadier layouts, and snappier interactions translate into more people actually seeing and using the content that is supposed to convert.
Increase conversion rate
Rankings are nice. Revenue is nicer. Speed turns more of your hard-won traffic into pipeline, and the math is easy to sanity-check. Suppose you get 50,000 sessions a month, 1.2 percent of visitors request a demo or start a trial, your average deal value is 15,000 dollars, 35 percent of demos become SQLs, and 20 percent of SQLs close. That yields roughly 600 demos, 210 SQLs, and 42 wins. If you define pipeline as SQLs multiplied by average deal value, you are looking at about 3,150,000 dollars in monthly pipeline, with around 630,000 dollars in closed revenue. A modest lift compounds quickly.
Independent studies repeatedly link speed to engagement and conversion. Google/SOASTA reported that the probability of bounce rises sharply as page load increases from one to three seconds, and Deloitte’s “Milliseconds Make Millions” study found that small speed improvements had measurable conversion lifts across verticals. B2B funnels differ from retail, but I see the same pattern: faster pages improve form starts, reduce abandonment in multi-step flows, and increase assisted conversions across journeys.
Now apply that to the earlier example. If speed work moves demo conversion from 1.2 percent to 1.5 percent, that is 150 additional demos a month. At the same 35 percent SQL rate and 20 percent close rate, you add roughly 10 to 11 wins monthly. Even if your close rate softened a bit during seasonality, the top-of-funnel lift would still create a healthier pipeline. I also track micro-conversions - pricing page clicks, resource downloads, calculator use, time to first interaction on forms - because these leading indicators typically move first and explain why downstream meetings and SQL quality improve.
Why I prioritize fighting regressions
Speed wins are fragile. New deploys add scripts. Tag managers collect pixels. A Friday upload swaps a lightweight hero for a 5 MB autoplay video, and by Monday your form starts slide. That is how performance debt creeps in. The cost spikes exactly when you least want it - quarter-end, launches, or PR hits - when intent is high and patience is low. Slower pages then mean fewer MQLs, higher cost per opportunity, and a dip in SQL quality as the most impatient prospects leave early. It is painful and avoidable.
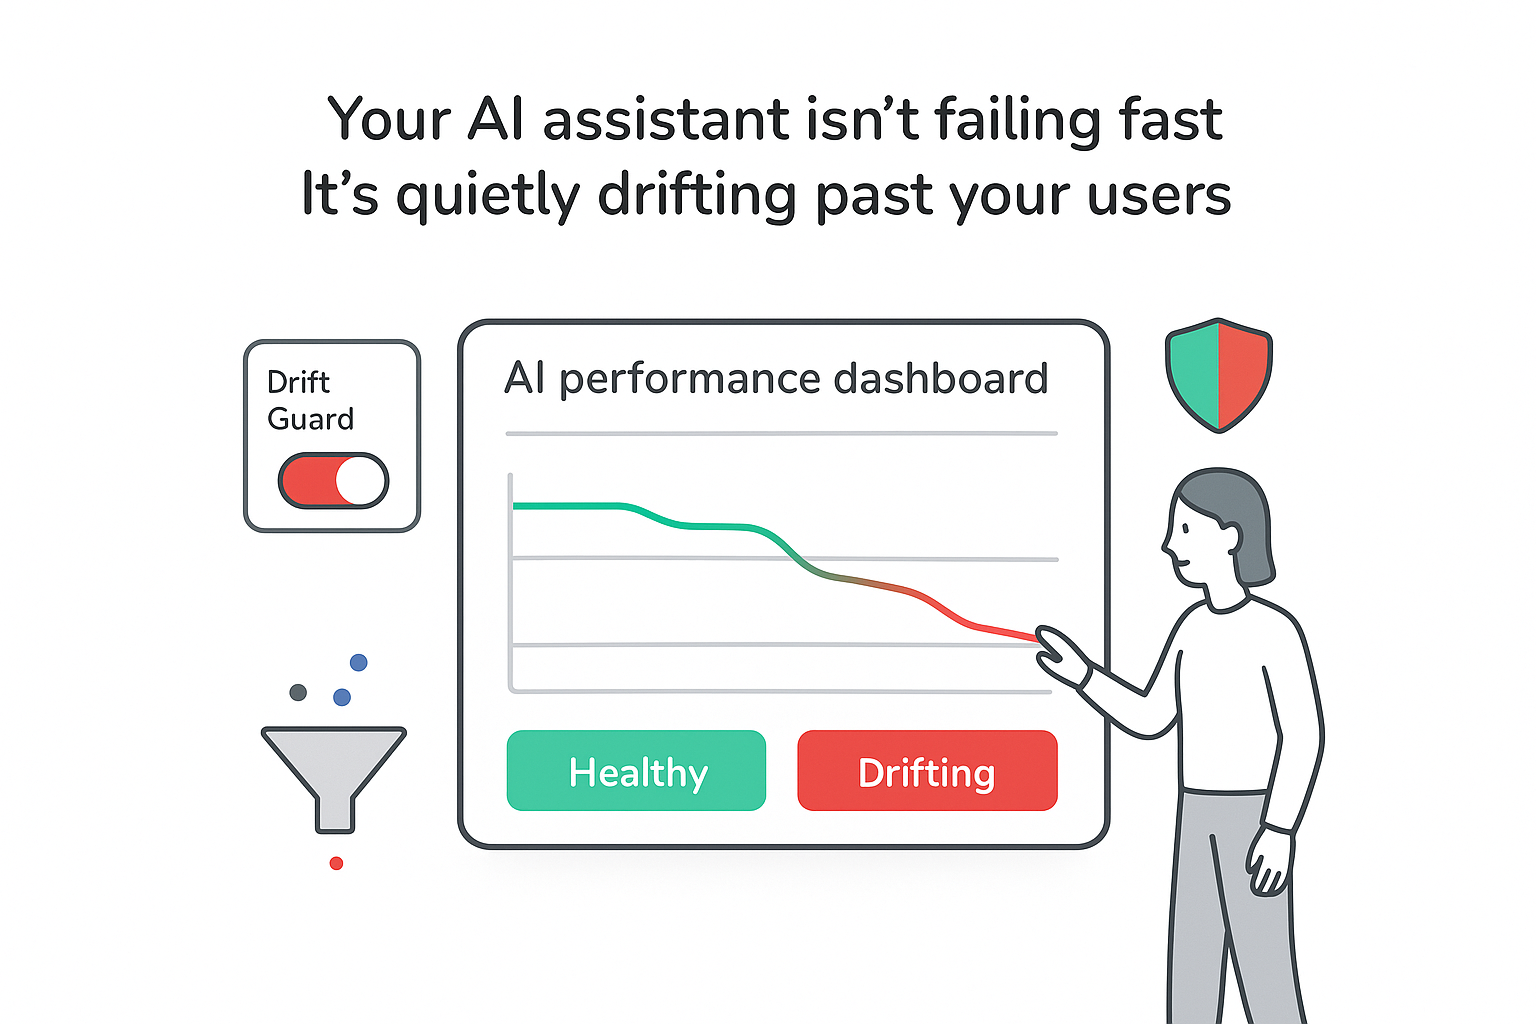
I do not rely on hero projects every six months. I put in guardrails that keep speed from drifting: a short set of tracked metrics, alerts for anomalies, and checks that run before code reaches production. A simple stability chart that flags sudden jumps will save hours of forensics and keep everyone calmer. The goal is steady, boring, reliable speed rather than periodic fire drills.
Performance budgets that tie to outcomes
Performance budgets are thresholds that draw a hard line for key metrics; when a page crosses the line, the right people know, and the change does not ship until it is fixed. Goals describe where I want to land (e.g., LCP near 1.8 seconds); budgets define what I refuse to get worse than (e.g., LCP must stay under 2.5 seconds on mobile). I use budgets in three places: design (limits on hero asset weight, font sets, and above-the-fold elements), frontend build (caps on JavaScript bundle size and render-blocking patterns), and delivery (checks before merges and deploys).
Here is a compact setup I recommend for B2B sites that drive revenue through demos and consultations:
- Pick a handful of metrics that leadership can recognize: LCP, INP, CLS, Time to First Byte (TTFB), and total shipped JavaScript per page. Map each to outcomes: LCP influences first impression and organic reach; INP affects form usability and flow completion; CLS affects perceived quality and trust; TTFB relates to crawl efficiency and backend health (Google has noted that slow responses can limit crawling); JavaScript size often dictates main-thread contention on mid-range phones - the core of mobile traffic.
- Choose the pages that move money: Home, Services/Solutions, Pricing, your primary lead form, and the top converting content entry point. Start there before boiling the ocean.
- Set thresholds from real-user baselines. I use the mobile 75th percentile from the last 28 days. I set budgets at the current worst acceptable level to prevent backsliding while I work toward more ambitious goals.
Keep the language in your status updates human. A CFO does not need a waterfall chart; they need, “LCP worsened last week due to a 1.2 MB hero image on Services; estimated impact minus six percent demo starts,” and a date the fix will ship.
What to optimize first
I work both ends: the server side to improve TTFB and the rendering path to shorten time-to-content and make interactions feel instant. On the server and network, I reduce origin latency, use caching where safe, and front content with a modern CDN to smooth distance and spikes. For the critical rendering path, I inline above-the-fold CSS, mark scripts async or defer, and preload the hero image and key fonts with sane font-display behavior. Media is usually the fastest win: modern formats like AVIF/WebP, aggressive compression, and responsive sizes do most of the work; I lazy-load anything below the fold and avoid auto-playing video in the hero. On JavaScript, I reduce, code-split, and tree-shake so each page only ships what it needs; I break up long tasks and audit third-party tags for cost and necessity. On CSS and fonts, I trim unused styles and limit font weights so I am not paying to load what the eye barely registers. These changes are not glamorous, but they move LCP, INP, and CLS in ways prospects can feel.
For quick wins on the Core Web Vitals that matter most in B2B, I focus first on: compressing and preloading the hero image while inlining critical CSS to improve LCP; cutting JavaScript, debouncing heavy handlers, and keeping the main thread free to improve INP; reserving space for images and embeds to prevent CLS.
A simple 30/60/90-day plan
- Days 1-30: Fix the top offenders on revenue pages. Compress or replace heavy hero assets, inline critical CSS, defer noncritical scripts, and remove dead tags. Expect visible improvements in both speed and form starts.
- Days 31-60: Reduce JavaScript bundles, code-split routes, upgrade protocols (HTTP/2 or HTTP/3), and put performance budgets in your delivery pipeline to prevent drift.
- Days 61-90: Tackle deeper refactors - design-system cleanup, component-level performance fixes, and smarter caching at the edge. This is where speed gains become durable, and maintenance gets easier.
If this sounds like a rebuild, it probably is not. Most teams earn 60 to 80 percent of the upside from a dozen targeted changes.
Web performance case studies
Example 1: B2B SaaS, mid-market. Mobile LCP was around 4.2 seconds on Home and Pricing; demo conversion sat near 1.0 percent. After compressing hero images, inlining critical CSS, preloading fonts, removing two render-blocking scripts, and enabling safe HTML caching, LCP improved to 2.1 seconds and demo conversion rose to 1.3 percent - a roughly 30 percent lift. With 80,000 monthly sessions and a 15,000 dollar average deal, the extra demos translated to roughly 360,000 dollars in additional monthly pipeline. Rankings for two high-intent terms also moved from positions 6 to 4, and clicks rose by double digits. The pattern: a small set of fixes, measurable gains.
Example 2: Consulting marketplace, enterprise buyers. INP hovered near 350 milliseconds on a multi-step intake form, with heavy drop-off between steps two and three. Splitting a large vendor bundle, deferring noncritical analytics, replacing an expensive input mask, and throttling over-eager live validation brought INP to 140 milliseconds. Form completion jumped from 41 percent to 51 percent, and sales reported fewer unqualified leads because prospects completed the context questions instead of quitting early.
Example 3: Cloud services, developer audience. TTFB spiked during content launches and delayed indexing of new technical pages. With tighter caching rules for static HTML, an upgraded origin, and “serve stale while revalidating” under load, TTFB fell by about 45 percent at peak. New docs began indexing within hours rather than days, organic visits to docs climbed 18 percent over a quarter, and assisted conversions moved in step. Faster delivery made content discoverable when it mattered most.
More resources
If you want to go deeper on the underlying standards and measurement, I point people to authoritative, vendor-neutral sources: Core Web Vitals and the INP update on web.dev, PageSpeed Insights for combined field and lab views, Lighthouse methodology on developer.chrome.com, WebPageTest for advanced synthetic measurement, and Chrome UX Report (CrUX) documentation for large-scale field data. These will give you definitions, thresholds, and examples without requiring you to babysit dashboards all day.
Start with Google Lighthouse for methodology and test details.
One last nudge. Speed work feels technical, yet the outcomes are human. People stay when pages feel instant. They read, they trust, they reach out. Keep the program light on ceremony and heavy on small, steady wins. When that happens, site speed becomes the quiet engine behind your brand’s pipeline - and it does not need you to babysit it every week.


.svg)