
Cohort analysis for customer lifetime value
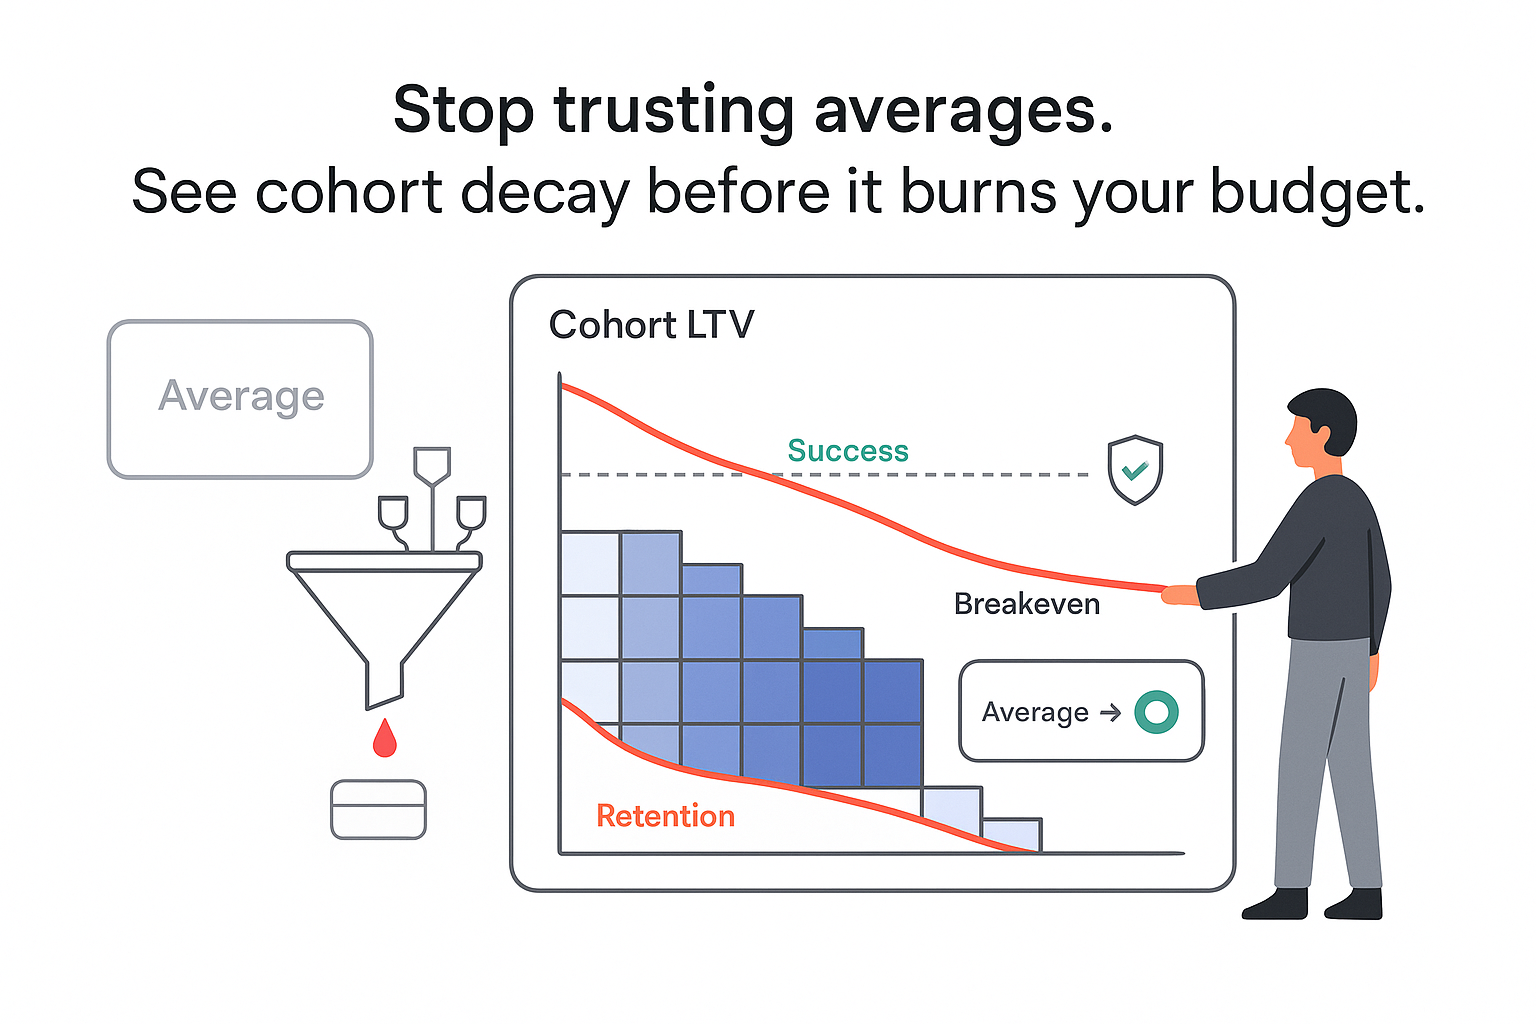
When I relied on averages and neat dashboards, I kept asking why leads that looked strong on paper churned early or stalled at renewal. The pattern was not random. It was buried in when and how each client was acquired, what they bought, and how engagement unfolded. Cohort analysis for Lifetime Value (LTV) turns scattered rows into a time-based view of real behavior. By grouping clients by a shared starting point and tracking retention, revenue, and margin over time, I cut noise, make LTV predictable, and make CAC decisions smarter.
This method lets me see which sources and packages create sticky accounts, how long payback actually takes by channel, and where expansion lives. That clarity tends to reduce wasted budget, increase LTV to CAC, shorten payback, and filter out bad-fit leads before they clog the pipeline. The core advantage is simple: cohorts measure behavior as it happens, not averages that hide decay.
What is cohort analysis
Cohort analysis groups accounts by a shared event, then tracks them through time. For services, useful cohort definitions include:
- Time-based: signup month or contract start month.
- Source-based: referral, partner, paid search, social, events, outbound SDR.
- Behavior-based: onboarding finished within 30 days, kickoff attended, usage milestones hit, ticket volume. Identify and track key actions that correlate with retention.
- Structure-based: industry, company size, project size, service package, sales rep.
How it differs from segmentation: segmentation slices your audience right now. Cohorts are time-anchored, so I can see what happens after the start. Averages hide decay; cohorts show it month by month.
Concrete example: I compare my January LinkedIn paid cohort and my January referral cohort. Month 1 survival looks similar. By month 4, referrals keep 78 percent of accounts, while LinkedIn drops to 52 percent. Expansion diverges too. Referrals add project extensions in months 5 to 8, while LinkedIn shows small upsells that do not cover extra support time. Look only at aggregates and both groups seem fine. Look at cohorts and the split is obvious and actionable.
Mini glossary
- Cohort: a group that shares a start event like contract date.
- Churn: account loss or revenue loss within a period. For a deeper dive, see this cohort-based churn calculation.
- Survival rate: share of the cohort still active at a given time.
- Cumulative revenue: total revenue collected from the cohort to date.
Implement cohort analysis
Here is the plan I hand to ops or analytics when I want clear, comparable cohort readouts.
1) Extract the right data
Accounts: IDs, start dates, acquisition source, firmographics, package, sales rep. Financials: invoices or subscriptions with dates, amounts, refunds, discounts, and gross margin. Engagement: onboarding completion dates, milestone completions, meeting attendance, email response, and ticket volume. Keep IDs consistent across systems, and standardize missing dates before analysis. Pulls are straightforward with SQL and exportable to Excel or Google Sheets.
2) Build cohorts
Start with monthly acquisition cohorts; roll up to quarterly if sample sizes are small. Add one structural cut like package or industry to expose margin and renewal patterns. As a rule of thumb, aim for 30+ accounts per cohort; if you cannot, aggregate neighboring months or group tail sources as “Other.”
3) Pick metrics that match decisions
Track retention and churn by account and by revenue. Separate expansion and contraction, clearly labeled and not mixed with new revenue. Monitor gross margin percent, not just top line. Calculate CAC and payback by cohort for channel-level calls.
4) Analyze patterns
Plot survival at 30, 60, 90, 180, and 360 days; mark where curves flatten or drop. Compare sources on LTV to CAC and payback; flag packages with high ticket volume but low margin. Separate new vs. expansion revenue curves so growth does not mask leakage. Visualization tools like Tableau, Mixpanel, Matomo, or Google Analytics 4 make cohort heatmaps and retention curves easy to read.
5) Act, then review
Reallocate budget toward higher-LTV, faster-payback cohorts; slow or pause the laggards. Fix onboarding where early drop is steep; shorten time to first value for the at-risk source. Adjust packaging where margin is thin or support-heavy; clarify scope and move costly features up. Re-run monthly with a deeper quarterly review to see if changes stick.
Pitfalls I avoid
Do not mix new and expansion revenue in one curve without labels. Keep attribution consistent; pick first-touch or last-touch and hold it constant. Do not ignore contract terms; a 12-month term can mask churn until renewal, so add flags for term length and auto-renew.
Template fields I find useful
cohort_id, start_month, account_count, starting_MRR/ARR, cumulative_revenue, gross_margin_percent, churn_flag per period, expansion_revenue per period, source, package, industry.
Practical time-to-value milestones
By 30 days: reallocate part of spend away from weak month-1 survival cohorts toward sources that show stronger early retention. By 60 days: tighten onboarding for one at-risk source based on engagement gaps; consider trimming an offer that draws high-support, low-margin accounts. By 90 days: refresh pricing or packaging for a low-margin service cohort; scale one high-LTV cohort with higher bid caps or more outbound touches.
Predictive LTV modeling
Descriptive cohorts are often enough to make better decisions. I move beyond them when I plan multi-quarter budgets, face longer sales cycles, or manage channels with different payback times. For background on modeling approaches, see this primer on Lifetime Value (LTV).
Methods that work well in services:
- Survival analysis: fit retention curves to forecast how many accounts remain active over time. Kaplan-Meier is a strong non-parametric baseline; a simple parametric curve can be more stable when data is sparse.
- BG/NBD-style models: useful when clients purchase repeat projects (e.g., audits or implementation sprints) at irregular intervals; these estimate purchase frequency and active status. For background, see work by Fader and Hardie on customer base analysis.
- Retention curve extrapolation: when I have six months of clean data, I extend to 12–18 months with conservative bounds and sanity checks.
To keep forecasts honest, I backtest against a holdout cohort. If a month-6 prediction is off by more than about 10 percent, I tighten the model or shorten the horizon. I also include confidence bands. Planning needs ranges, not single-point fairy tales.
How I pick an approach quickly: under 200 active accounts, use descriptive cohorts plus cautious curve extrapolation. From 200 to 1,000, add survival analysis with holdout tests. Over 1,000 or with high project repeat rates, layer BG/NBD and a light engagement-based churn classifier.
Net present value
In long B2B cycles, money later is worth less than money now. NPV-adjusted LTV pulls timing into one number that aligns better with cash planning.
Simple setup
Discount rate: I use 8 to 15 percent annually based on cost of capital and risk; 10 percent annually is roughly 0.83 percent monthly. NPV-adjusted LTV: discounted cash flows from a cohort, multiplied by gross margin percent. Full view: NPV LTV minus CAC gives contribution; LTV:CAC and CAC payback tell me what to scale.
Numeric example
Unadjusted LTV per account: 30,000 over two years at 65 percent gross margin. Contribution looks like 19,500. Apply a 10 percent annual discount to equal monthly cash flows. The revenue NPV is about 27,150; at 65 percent margin that is roughly 17,650. If CAC is 5,000, the unadjusted LTV:CAC is 3.9; the NPV view is about 3.5. That gap can flip a channel from green to yellow in a plan.
Practical extras
Shorter-payback channels can win even if total LTV is slightly lower, because cash returns faster. Annual prepay improves NPV by pulling cash forward and often reduces churn risk. For segment-level decisions, I sometimes vary the discount rate; a mature, high-engagement cohort can justify a lower rate than a new, untested one.
Reduce churn
Insights are nice; action pays the bills. I use cohort signals to drive specific moves.
Onboarding and early experience
If a source cohort shows a steep month-1 drop, I redesign the kickoff for that source: compress time-to-first-value, add a welcome call within 48 hours, and orient activation around the one task most correlated with stickiness. If industry cohorts stall at the same milestone, I add an industry-specific resource or path to unblock it.
Client success playbooks
I tailor playbooks by contract value. Enterprise accounts get quarterly reviews with a roadmap and success metrics; mid-market gets a lighter monthly check-in and a quarterly recap. I maintain a renewal watchlist tied to signals like late invoices, low meeting attendance, shrinking usage, or fewer project updates. Two months before renewal, I engage with a plan, not a plea.
Packaging and pricing
If a package attracts low-margin accounts, I adjust scope or move costly features up; a small setup fee can offset high onboarding costs. If expansion lives mostly in one package, I build a simple bridge so more accounts can step into it earlier, for example a one-month pilot upgrade.
Channel reallocation example
If a paid social cohort shows 45 percent survival at month 6 and a long payback, while referrals show 80 percent survival and faster expansion, I shift 10 to 20 percent of spend toward the higher-quality source for one quarter and watch the next cohorts. If lift holds, I move more.
Quick wins
Proactive outreach on late invoices or stalled milestones within 14 days. Expansion prompts at known trigger points, such as after a case study or a milestone completion. Clear service-level agreements between sales and delivery so handoffs do not leak confidence.
Cohort analysis misconceptions
Myth 1: You need thousands of customers.
Reality: You do not. Aggregate by quarter and you can get stable reads with a few dozen accounts.
Myth 2: It is only for SaaS.
Reality: Project-based and retainer services benefit as well. The start event and milestones differ; the method does not.
Myth 3: It is a one-time project.
Reality: Markets change. I update monthly, run a deeper review each quarter, and keep playbooks current.
Myth 4: It is too technical.
Reality: You can start in a spreadsheet with three columns (cohort start month, revenue, status) and move to BI when volume grows.
FAQs
How does cohort analysis provide more accurate lifetime value estimations than traditional methods?
I anchor clients to a start date and track survival and revenue through their lifecycle, which avoids survivorship dilution and exposes channel- or package-specific decay. For instance, a partner cohort might keep 75 percent of accounts at month 12 while a paid search cohort keeps 50 percent, materially changing LTV and payback by channel.
What data and tools do I need to perform a cohort analysis for estimating customer lifetime value?
I need CRM records with start dates and sources, billing or invoicing with amounts and refunds, gross margin, and engagement signals like onboarding or milestone dates. I can start with spreadsheets like Excel or Google Sheets, query data with SQL, and add an analytics layer with tools such as Google Analytics 4, Mixpanel, Matomo, or Tableau when volume grows. The critical discipline is clean IDs, standardized dates, and one consistent attribution model.
How can businesses use cohort analysis to improve customer lifetime value and retention?
I use it to guide three plays. First, tighten onboarding where early drop is highest; case studies in services often show meaningful reductions in early churn when time-to-first-value is shortened. Second, refine pricing and packaging so low-margin packages stop soaking up support. Third, reallocate budget into higher-LTV cohorts, which commonly lifts LTV:CAC and shortens payback. Actual ranges will vary by segment and cycle.
Related posts
Author
I am a growth strategist who builds organic pipelines for B2B service leaders, blending SEO, analytics, and a slightly obsessive love for clean CRM data.


.svg)

.svg)
.svg)