
Client reporting tips
I build reports that get read, spark useful decisions, and tie the work to pipeline and revenue. I keep it simple, practical, and built for a B2B services CEO who only has five minutes between calls. This playbook stitches data to business outcomes, sheds fluff, and replaces activity updates with clear wins, risks, and next moves that lower CAC and improve LTV over time.
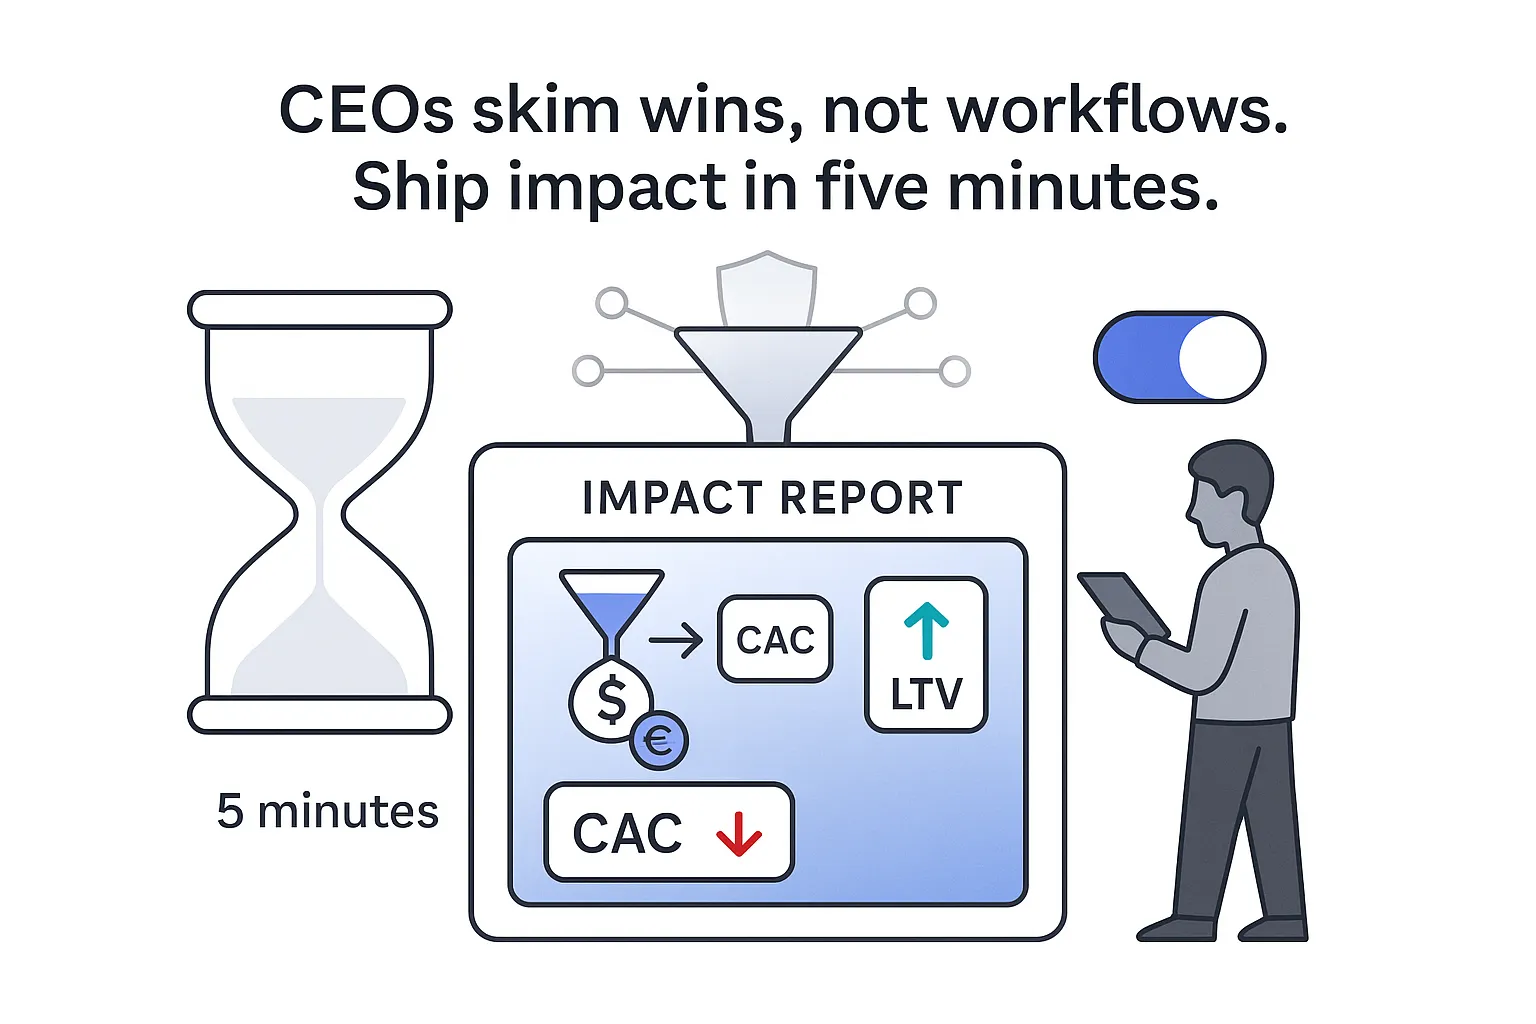
Stop activity updates. Show business impact. I wrote these client reporting tips for B2B service leaders who care about pipeline, revenue, and keeping acquisition costs in check. You will see how to structure reports, write like a human, and present in a way that drives decisions without extra meetings or micromanagement.
Communicating impact
Activity is busywork. Impact is business. I anchor reports around outcomes with a quick, repeatable frame any CEO can skim.
Impact summary frame I rely on
- Objective → What was I trying to change?
- Action → What did I do?
- Outcome → What moved in the data?
- Business impact → What did it add to pipeline or revenue?
- Next step → What decision or action comes next?
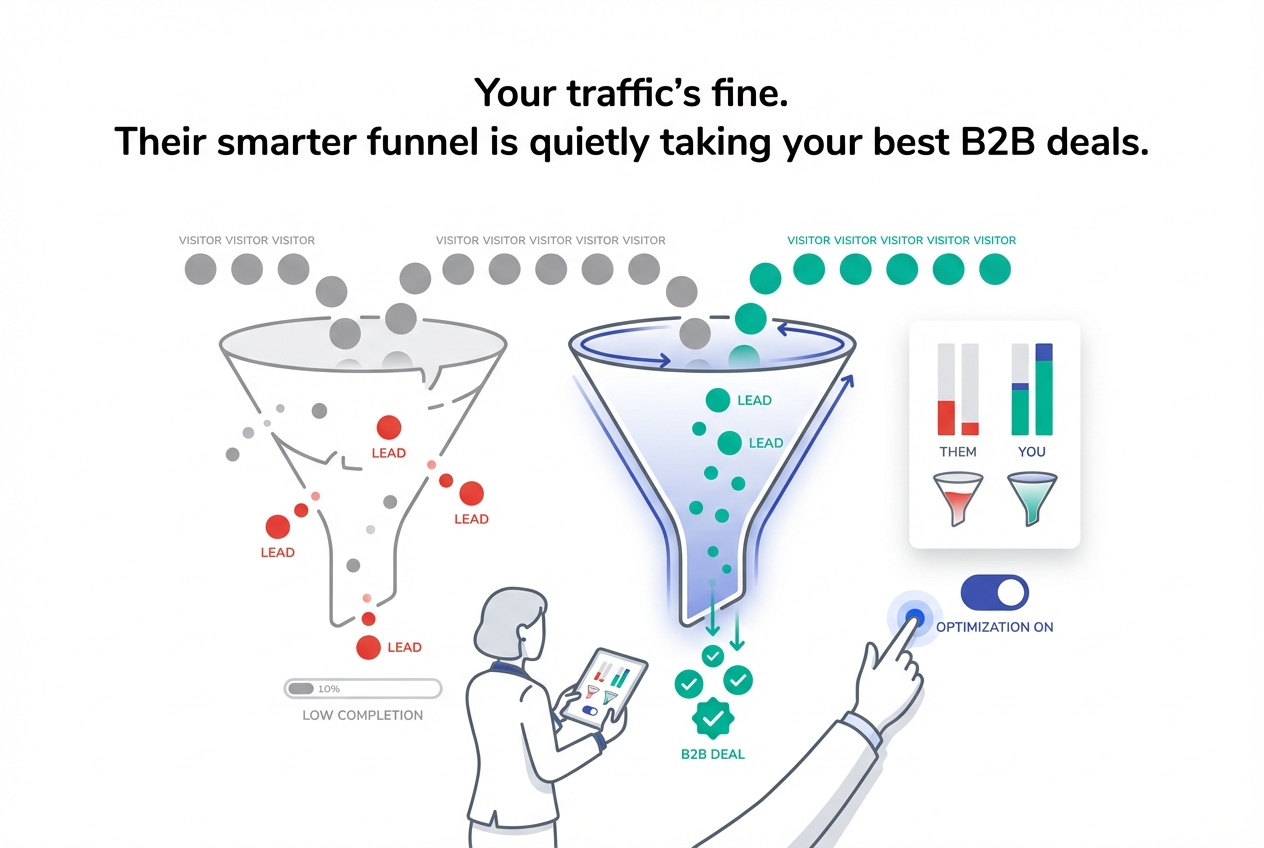
I make every section map to revenue. For B2B services, connect the dots the same way every month: MQL → SQL → Pipeline → Closed Won. Use consistent math and attribution so trend lines hold up under scrutiny.
Simple mapping example
- Objective: Increase qualified demo requests from mid-market firms.
- Action: Refined paid search keyword groups, updated landing pages, and added a Calendly CTA.
- Outcome: MQLs up 28 percent, SQL rate up 6 points.
- Business impact: 46 SQLs added, $1.2M pipeline created, $240K projected revenue based on close rate.
- Next step: Shift 15 percent of budget from low intent to high intent terms and replicate the top landing page layout across two new service pages.
Quick wins vs long-term compounding wins
- Quick wins this period:
- Reduced lead form fields from 6 to 3. Result: +18 percent conversion, CAC down 12 percent.
- Fixed 404s on paid landing pages. Result: Bounce down 22 percent, better quality scores.
- Compounding wins building over time:
- New problem-aware blog cluster with internal links to service pages. Expected lift: 3 to 6 months.
- Review schema and G2 quote snippets added to high intent pages. Expected lift: 1 to 2 months.
ROI and payback, plain and simple
- Period revenue attributed: $180,000
- Period costs: $60,000
- ROI: ($180,000 − $60,000) ÷ $60,000 = 2.0x. Also consider Return on Ad Spend (ROAS) when paid media is a major lever.
- Payback period: Total cost ÷ average monthly net revenue from these efforts
- Trend vs baseline: pipeline ▲ 19 percent, CAC ▼ 11 percent, LTV:CAC ratio ▲ from 3.1 to 3.5
I keep assumptions visible - models, conversion rates, attribution choices - so nobody has to guess.
Clients don't read reports
Hard truth. It is not because they do not care. It is because the report reads like homework. I fix that by designing for the real way busy leaders consume information.
Why reports get ignored
- Too long, no skimmable summary
- Jargon without definition
- No narrative linking actions to outcomes
- Insights buried under screenshots
- Unclear next steps and no owners
Reader reality checklist
- Can be skimmed in 5 minutes
- Starts with outcomes, not activities
- Ends with decisions and owners
- Avoids vanity metrics without context
Three-slide exec deck for the busiest clients
- Slide 1: Impact summary - pipeline added, CAC trend, LTV:CAC, top win, top risk.
- Slide 2: What changed and why - 3 bullet insights with the so what spelled out.
- Slide 3: Decisions and next steps - owner, due date, expected impact.
At a glance box for page one
- Top 3 wins
- High intent keywords drove 46 SQLs
- New pricing page lifted conversion 14 percent
- Email re-engagement brought back 37 dormant leads
- Top 3 risks
- Branded CPC rising 23 percent
- Slow follow-up on weekend leads
- Two service pages still lack proof points
- Top 3 next moves
- Shift budget to highest intent terms
- Add testimonials and case proof to service pages
- Weekend coverage SLA for inbound
Report structure
A consistent layout keeps everyone grounded. I use the same order every month so a CEO’s brain builds a mental map. Create clean, branded, easy-to-read reports that match your agency’s brand and pull data from every platform. Start with a visual summary. For a walkthrough, see How to create an automated KPI dashboard for clients.
Recommended layout
- Executive summary
- Pipeline added, CAC trend, ROI, decisions needed.
- RAG status for the program: Green, Amber, or Red.
- KPI overview
- Leading indicators: qualified traffic, demo requests, MQL to SQL rate, time to first response.
- Lagging indicators: pipeline, revenue, LTV:CAC.
- Trend arrows: ▲ up, ▼ down, ▶ flat.
- What changed and why
- Context: what I tested or fixed.
- Insight: what the data showed.
- Implication: what it means for the business.
- Wins and losses
- Wins: short bullets with quantified impact.
- Losses: what slipped and what I am doing about it.
- Risks and blockers
- Risk, likelihood, impact, and the owner removing it.
- Recommendations with owners and due dates
- Effort vs impact tags: Low or High effort, Low or High impact.
- Simple decision asks like approve a budget shift or sign off on copy.
- Roadmap
- Next 30, 60, 90 days with one line per item.
Let stakeholders tailor what they see. Customize views by role or goal and use AI-powered insights to move from data dumps to clear takeaways. For frameworks, try 8 Plug-and-Play Marketing KPI Templates to Prove Client ROI and pick visuals from Top Data Visualization Tools in 2025: Compare Features, Benefits & Pricing.
One-page view
- Top row: KPI tiles with trend arrows and RAG.
- Middle: Impact summary and at-a-glance box.
- Bottom: 3 key insights and 3 next moves with owners.
Detailed appendix
- Channel-level views by SEO, paid, social, email.
- Segment views by market or service line.
- Test results with one insight per chart.
Mini readability checklist
- Plain language and short sentences
- Font size 14 to 16pt
- Use color sparingly; rely on labels
- Avoid dense tables
- One insight per chart
- All charts labeled, no guesswork
- Alt text so everyone can read it
Communication style
I write like a person. I keep reading ease in the 6th to 8th grade range. Active voice. Short words. No acronyms without a quick hint the first time they show up. When in doubt, link to simple definitions clients can scan, like Click-Through Rate (CTR) and Cost Per Lead (CPL).
Replace vanity metrics with so what statements
- Pageviews are up 25 percent, so what? Qualified leads rose 18 percent and CAC fell 12 percent.
- Time on page improved, so what? More visitors reached the booking CTAs and demos increased.
Use a narrative block that reads like a story
- Context → Insight → Implication → Action
- Example: I removed friction from the booking flow. Conversion from visit to booked demo rose 18 percent. This lowers CAC and adds $320K in pipeline. I will roll out the same form on two more pages next sprint.
De-jargon a stiff paragraph
- Before: I executed a multi-pronged funnel optimization across SEO and paid to catalyze down-funnel conversion. CTR increased 14 percent due to improved ad rank.
- After: I tightened ad groups and fixed the landing pages people saw. More of the right people clicked. More of them booked calls.
Add social proof without the fluff
We finally see which channels feed pipeline. I can make budget calls in minutes, not hours.
Stop doing box
- Stop stuffing reports with screenshots from every tool
- Stop using acronyms without a quick note
- Stop listing activities without a takeaway
- Stop hiding risks until they become fires
Client presentation
Do not just send. Show. The right ritual takes 30 minutes and turns reporting into decisions. Keep communication inside the report when possible using a client messaging tool.
30-minute agenda
- 5 minutes: Executive summary and impact
- 10 minutes: Insights worth action
- 10 minutes: Decisions and budget calls
- 5 minutes: Confirm owners and due dates
Make it easy to rewatch and share
- Record the meeting and share the link.
- Send a 2-minute screen-recorded recap walking through the summary page.
- Attach the deck and the decision log in a shared doc. Also schedule delivery so it lands on time without nudges.
Decision log fields
- Decision, owner, due date, expected impact, status
- Keep it living so the team stays honest without constant check-ins. Tie it to your task management software to close the loop.
Office-hours window
- Hold a weekly 30-minute window for async questions via your existing channels (email or chat).
- This reduces back-and-forth and prevents surprise asks at month end.
Quarterly executive review
- Deeper look at compounding results
- Budget and channel mix for next quarter
- Scenarios: what if I move 10 percent from low intent to high intent, or boost content output by 20 percent
Client education
I teach the model, keep it simple, and build confidence. When a CEO understands how the machine works, patience goes up and outcomes get better.
Lead and lag metrics
- Lead: qualified sessions, demo requests, reply rate, speed to lead
- Lag: pipeline, revenue, LTV:CAC, retention
- Visual tip: Stack lead metrics above lag metrics so cause appears before effect.
Seasonal effects and context
- Show last year’s trend lines next to this year
- Label seasonality like Q4 freezes or summer slowdowns
- Call out one-off events, not just averages
Attribution caveats
- Multi-touch is messy. That is normal.
- Use a primary view like last non-direct click and a secondary view like position-based.
- Explain gaps gently. Example: Some LinkedIn influence shows up as organic branded search in analytics.
Glossary sidebar for page one
- MQL: Marketing qualified lead that matches fit and intent
- SQL: Sales qualified lead that booked and passed a screen
- CAC: Cost to acquire a customer
- LTV:CAC: Ratio showing the health of acquisition spend
How channels work together
- SEO builds intent and reduces paid costs over time
- Paid captures ready buyers and supports testing
- Social and email keep the pipeline warm between touches
- Sales speed to lead turns interest into meetings
Expected timelines
- 30 days: Fix broken flows and plug leaks that waste spend
- 60 days: Improve conversion paths and shift budget to higher intent
- 90 days: Publish topic clusters, harden proof on service pages, see early organic lift
- 6 to 12 months: Compounding organic traffic, lower blended CAC, stronger LTV:CAC
How to read this report micro-guide
- Page one shows business impact first
- Every chart has one insight and a clear takeaway
- Red, Amber, Green flags show health at a glance
- Decisions are summarized at the end with owners and due dates
For deeper how-tos, see How to create an automated KPI dashboard for clients and 8 Plug-and-Play Marketing KPI Templates to Prove Client ROI.
Final thought that doubles as a reminder
These client reporting tips work best when I repeat them the same way every month. I keep the story tight. I measure what matters. I put decisions on the page. When reports are built for how leaders read, they get read. When they tie actions to money, they get funded. And when I own the results, I keep the client and grow together.


.svg)

.svg)
.svg)