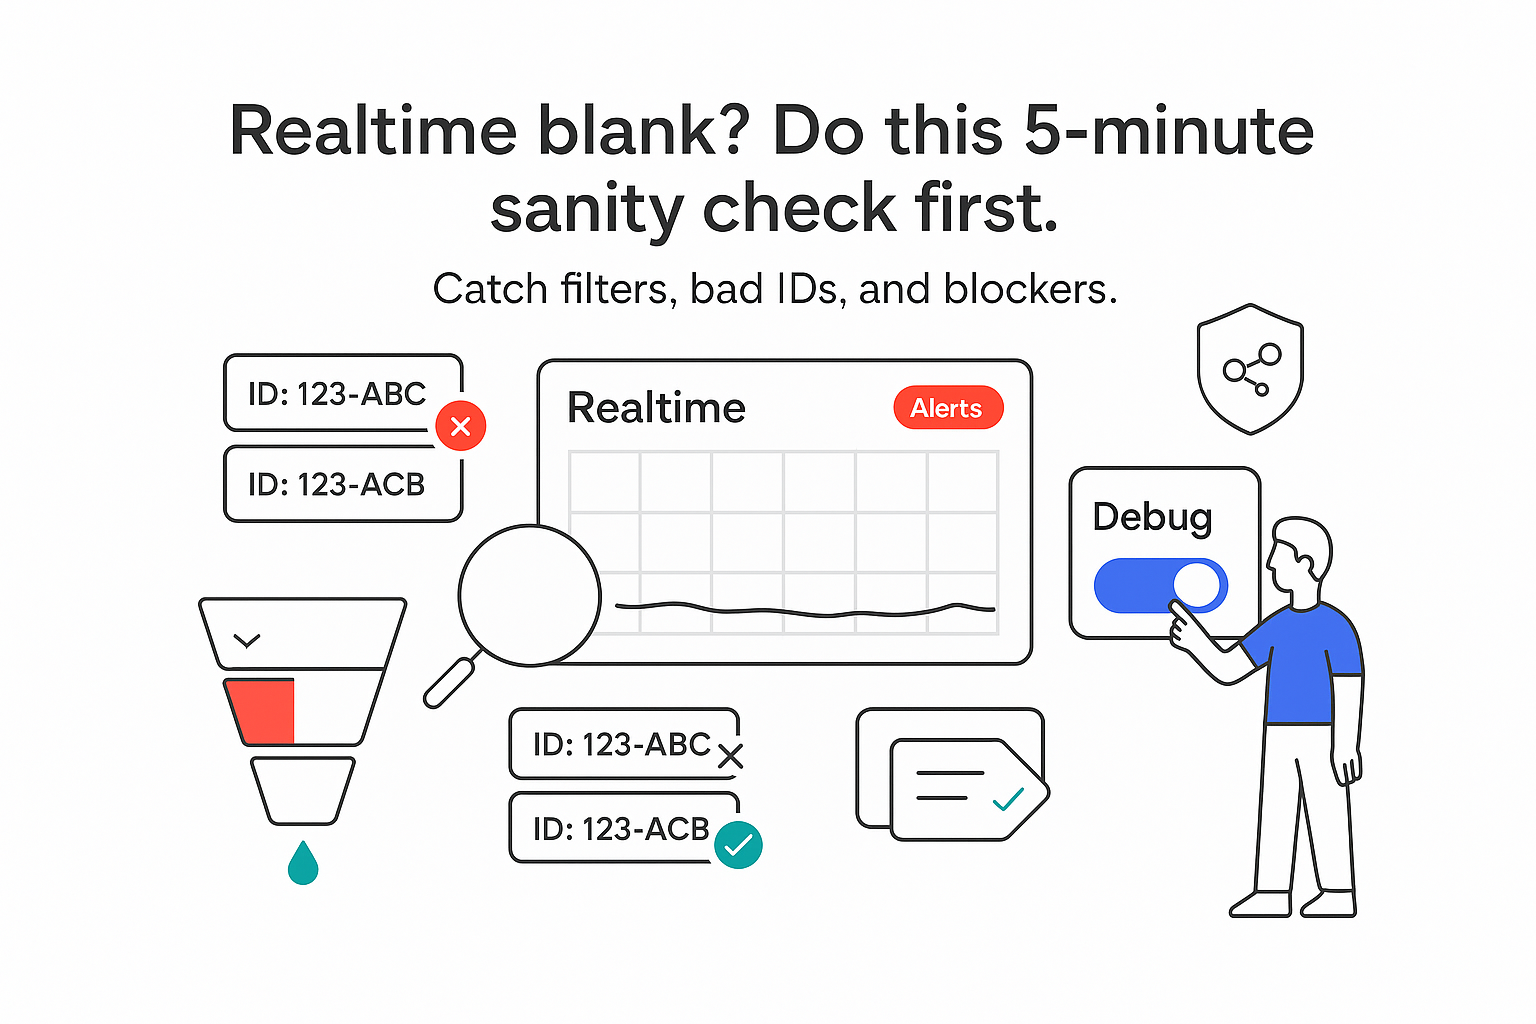
I open GA4, tap into Realtime, and... zero. No users, no events, just a cold empty chart. Annoying - especially when I need fast answers and I have a meeting in 15 minutes. The good news: most fixes are quick. Here is how I go from "nothing is showing" to "yep, it is firing" without wasting the afternoon.
Google Analytics real-time not working
When Realtime shows nothing, I assume it is one of three culprits: a filter hiding my visits, the wrong property or stream receiving data, or something blocking calls (extension, VPN, or strict browser). I tackle them in that order and only go deeper if they do not explain the silence.
Start with quick confirmations
Before chasing edge cases, I do three fast checks in a clean browser session. They remove guesswork and tell me whether events are firing at all.
- Open Admin > DebugView to confirm events arrive locally. If DebugView is silent, tags are not firing or are being blocked. If you suspect GTM issues, a refresher on the most common GTM mistakes can help.
- Use Tag Assistant (either via Admin > DebugView helper or the browser extension) to confirm which GA4 Measurement ID actually fires. If needed, here is how to check that Google Analytics 4 is installed on a website.
- Test my site in an Incognito window with extensions disabled, keep Realtime open in another window, and trigger a couple of interactions. A short delay is normal - I expect to see myself within a minute.
A brief reality check: Realtime is near live, not perfect. Small delays happen, and active filters, consent settings, or thresholding can suppress what I see in Realtime even when standard reports later fill in modeled data.
Internal filter is active
If DebugView shows events but Realtime stays empty, an internal traffic or developer filter often explains it. GA4 can exclude my visits based on IPs, parameters, or environment hints - great for clean data, not so great when I am testing. If you need a setup guide, see That feature.
I verify the filter states in Admin > Data settings > Data filters. Internal and Developer filters show a status of Testing or Active. Testing means GA records events and labels them as test (they still appear in Realtime). Active excludes them entirely. If Internal is Active, I temporarily switch it to Testing, hard refresh the site, and click around while watching Realtime. If I appear, I have found the reason. I leave it in Testing while validating and flip it back to Active when I am done.
If my team uses IP-based rules, I open Admin > Data streams > my web stream > Configure tag settings > Show all > Define internal traffic and confirm my current IP or CIDR range is not unintentionally included. If I see parameter-based rules (for example, using custom flags or debug_mode), I make sure my QA setup does not accidentally match them. Developer traffic can also be filtered if a browser flag or environment parameter triggers it, so I scan those settings as well.
One more nuance: on VPNs or office proxies, IPs can be pooled, so more people may be filtered than expected. When that is the case, I keep a simple record of current IPs or rely on parameter-based logic scoped to my QA environment.
Wrong GA4 property or tag misconfigured
It sounds too simple, but it happens constantly: I test one property while the page fires to another, or a staging container is still live, or a CMS plugin quietly injects a second GA tag.
I copy the Measurement ID (G-XXXX...) from Admin > Data streams for the web stream I intend to test, then compare it with the ID Tag Assistant shows firing on pageview and events. If they do not match, I fix the tag or the container source, republish if needed, and retest. If you are unsure where to find it, this guide to the GA4 measurement ID helps.
I also look for double tagging (two GA4 tags firing to different G-IDs) and confirm my production environment is not loading a staging GTM container. If I am using gtag hard-coded, I verify the ID in the source and make sure it is present on all pages. If I am using a CMS integration, I check that it is not adding a duplicate GA4 tag behind the scenes. Need a refresher on setup paths? Here is how to install GA4 with Google Tag Manager or install it with a native GA tracking code, known as GTAG.
To confirm I am in the right place, I keep the correct GA4 property open in Realtime while Tag Assistant is running, reload the page, and trigger a couple of interactions. I should appear within a minute if the tag path is correct and nothing is blocking the calls.
Extensions, VPN, or privacy browsers blocking tracking
Privacy tools are excellent for users and occasionally painful for testers. Ad blockers (uBlock Origin, AdGuard, Ghostery, DuckDuckGo, AdBlock Plus, Privacy Badger), privacy-focused browsers or modes (Brave Shields, Firefox Enhanced Tracking Protection, Safari's Prevent Cross-Site Tracking), and VPN-level protections (including enterprise DNS or firewall rules) can block GA or GTM requests entirely. That produces a quiet Realtime even when my tags are set up correctly.
Common culprits include the Google Analytics Opt-out add-on, Block yourself from analytics, and VPN features like Threat protection.
I use a simple flow to isolate the blocker:
- Test in Incognito with extensions disabled. If Realtime works there, I re-enable add-ons one by one to find the culprit.
- If Incognito still fails, I turn off the VPN or check corporate filter rules. GA and GTM endpoints such as *.google-analytics.com, *.analytics.google.com, and *.googletagmanager.com must be allowed (plus my server-side tagging domain if I use one).
- If I am still stuck, I open DevTools > Network, filter for collect and gtm.js, and check whether requests are blocked or failing. If gtm.js is blocked, GA4 loaded via GTM will not fire either.
Reports overview and quirks
For orientation, Realtime sits under Reports and shows the last 30 minutes of activity, updating as new events arrive. Standard reports are batched, modeled, and sometimes delayed, so they will not always match what I see in Realtime right now. If you are new, start with Google's Overview of Google Analytics reports and the GA4 Reports hub. Prefer video? Watch a video about Google Analytics reports.
A few behaviors matter when I am troubleshooting:
- Delays: Realtime is quick but not instantaneous - a minute or two is normal.
- Thresholding: With Google signals or sensitive data protections, some metrics may be limited for privacy, which can make Realtime look sparse.
- Consent: If a visitor rejects analytics consent and I use advanced consent mode, Realtime may not show those events even though modeled data appears later in standard reports. If you are digging deeper into consent, this Google Tag Manager course for beginners covers the fundamentals.
- Debug vs normal: Events sent with debug_mode show in DebugView regardless of most filters, but Realtime respects active filters and consent logic.
- Comparisons: Using Realtime comparisons can hide traffic unintentionally. If you are unsure, review how Comparisons work.
Google Analytics real-time not working: final words
If I have reached this point, I have usually cleared the major blockers. The short version that sticks:
- Filters: Check Internal and Developer filters. Use Testing while validating. Remember that Active hides those visits in Realtime.
- Property: Confirm the GA4 Measurement ID in Admin > Data streams matches what Tag Assistant shows on my page. Watch for staging containers and CMS-injected duplicates.
- Blockers: Pause the ad blocker, disable VPN-level protections during tests, and be mindful of Brave or Firefox tracking protections. When in doubt, test in a clean Incognito session.
Fair expectations help. Realtime is quick, not perfect - a minute or two of delay is fine. Thresholding can limit what I see when privacy features are enabled. Consent mode can suppress real-time visibility while still contributing modeled data later. If I am using server-side tagging, I confirm the endpoint is not blocked by Content Security Policy or a network rule. If your developers need guidance, here are the instructions on what they should do.
If something still feels off, I broaden the lens: publish the GTM container if my preview looked good but production is silent; check the console and CSP directives for google-analytics.com, analytics.google.com, and googletagmanager.com; make sure I am sending to the right web data stream on the right property; review my consent manager's boot sequence to ensure it does not delay the first pageview unnecessarily; and remember that non-privacy extensions can still interfere with GA or GTM. DevTools is my final arbiter - if collect calls never leave the browser or get blocked, I note what is stopping them and adjust. If you suspect a wider outage, check this status dashboard.
For smoother operations, I like clear ownership and a predictable routine:
- One person owns GA4 property and stream naming.
- One person owns GTM versioning and publishing notes - and they always test it in preview mode before shipping.
- Everyone follows the same fast test path: Tag Assistant, DebugView, Realtime, then standard reports the next day.
That calm, predictable process turns a quiet Realtime panel from a headache into a five-minute fix - and it keeps my QA focused on signal, not noise.


.svg)