I do not need another jargon salad. I need a simple way to see if my marketing is working and where to fix it when it is not. That is where MER vs ROAS comes in. I treat MER as my P&L-friendly, all-channels view. I treat ROAS as my daily knob for channel and creative tweaks. I use both, but not for the same job. Especially in B2B services with longer sales cycles and offline touchpoints, I want a scoreboard that respects time lags, sales activity, and real revenue, not just clicks.
MER vs ROAS: how I decide what’s working
I start fast. If my goal is total profitability across channels, I use MER. If my goal is to optimize a channel, a campaign, or a creative, I use ROAS. I keep a weekly scorecard that tracks MER, pipeline value created, and sales-qualified leads. Then, once a month, I run a ROAS deep review by channel and by key campaign.
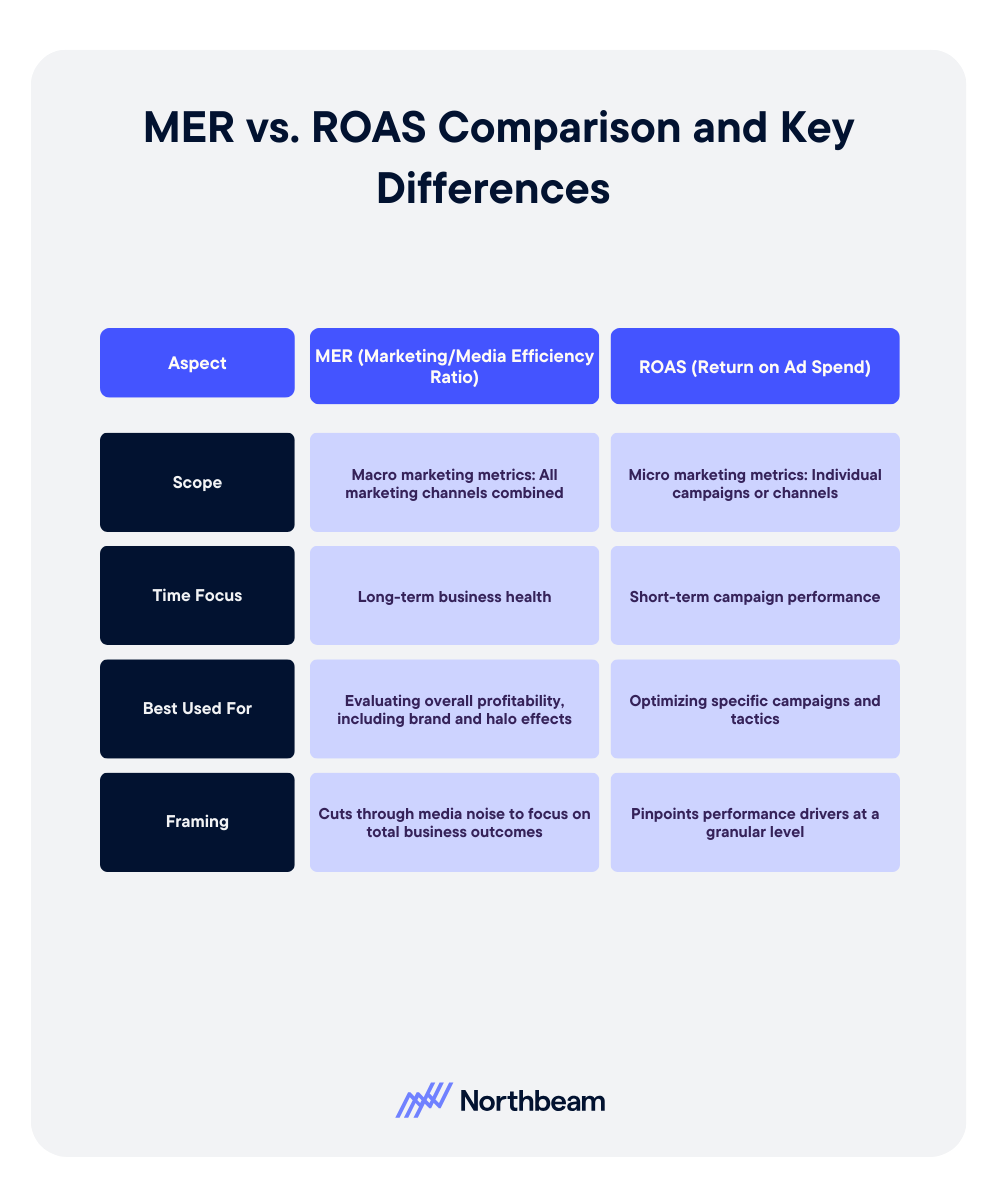
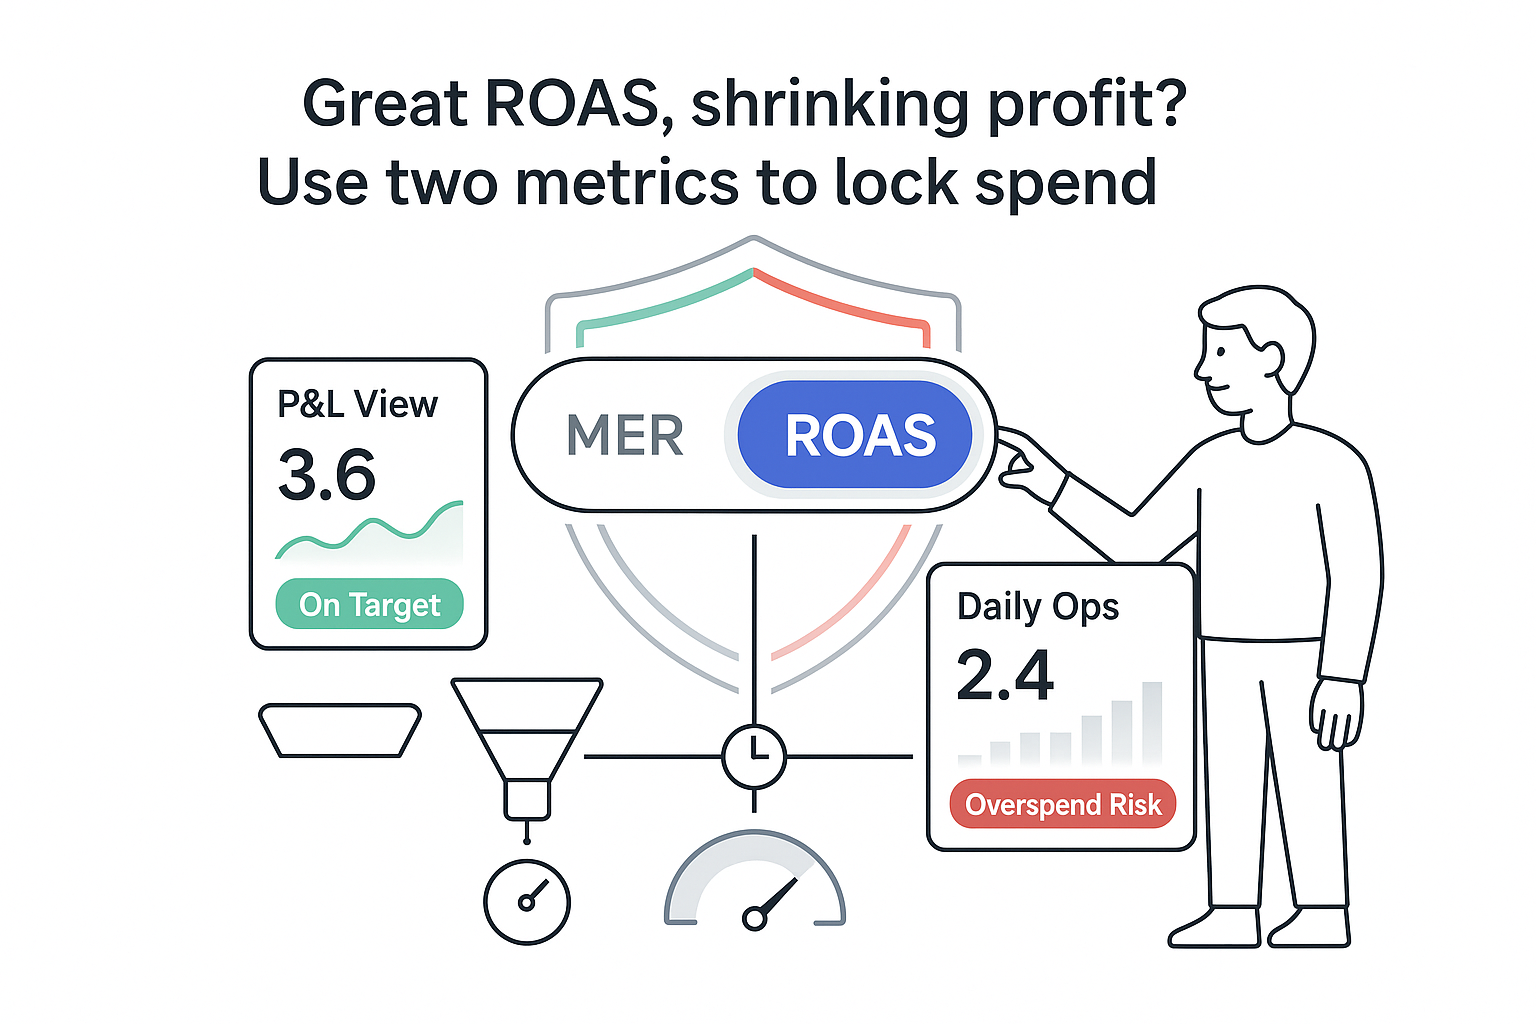
In one line: MER tells me if the entire machine is efficient. ROAS tells me which parts need tuning. In B2B services, the two often disagree in the short term because revenue lags, proposals sit, and deals close after several calls. That is normal. I use MER to set spend guardrails and pacing. I use ROAS to steer budget between platforms and creatives without starving the funnel.
Grounded definitions: MER and ROAS
MER. Marketing Efficiency Ratio (MER) equals total revenue divided by total ad spend for the same period. All channels. All campaigns. One number. It is a blended metric because it captures full-funnel effects, including untracked influence like referrals, word-of-mouth, and branded queries that do not attribute cleanly. It is simple to compute, aligns with how finance views performance, and it catches halo effects across channels. The tradeoff: MER can hide channel waste. A hero channel can carry two wasteful ones and the blended number still looks fine. For more context and benchmarks, see this overview of MER and this side-by-side on Marketing Efficiency Ratio vs ROAS.
B2B example. I spend 100,000 in Q1 across paid search, paid social, and a few sponsorships. I recognize 600,000 in new revenue during that period. MER equals 600,000 divided by 100,000, so 6.0. On paper, that is very healthy.
Caution. Attribution lag matters. Invoices get dated one month, revenue is recognized another month, and my CRM may mark Closed Won based on signatures that come weeks after first touch. I align my MER window to my finance calendar, then I spot-check with a trailing 90- or 180-day window. This reduces false alarms.
ROAS. Return on Ad Spend (ROAS) equals attributed revenue from ads divided by ad spend for that channel or campaign. It moves with two weekly levers I can influence: conversion rate and average deal size in B2B services. ROAS is great for channel and creative calls. It tells me where to push budget, which audiences to keep, and which offers are pulling their weight. But it often favors bottom-funnel campaigns and under-credits awareness. In B2B, this is trickier because revenue is delayed and much of the influence is offline. For a direct comparison, see Northbeam’s take on MER vs ROAS and this deeper walkthrough of return on ad spend (ROAS), and media efficiency ratio (MER).
Example. A paid search campaign attributes 80,000 in revenue on 20,000 in spend. ROAS equals 4.0. That is a good signal, but some of that revenue may have been influenced by a podcast, an event, or a LinkedIn thread that did not tag cleanly.
When revenue attribution is delayed, I track pipeline value by stage alongside ROAS: qualified leads, proposal value, and expected value by probability. That way my ROAS review still guides action while deals work through the cycle.
When I use each metric
- Scope: MER is business-level. ROAS is channel- or campaign-level.
- Time horizon: MER is long horizon and steadier. ROAS is short horizon and spiky.
- Decision use: MER supports budget allocation and reporting. ROAS drives daily optimization, creative tests, and channel rebalancing.
- Planning cadence: Planning and reporting equals MER. Daily optimization and A/B tests equals ROAS. Quarterly portfolio rebalancing uses both.
Extra B2B layer. I map both to pipeline stages: MQL, SQL, proposal, Closed Won. I use ROAS to improve MQL-to-SQL rate and cost per SQL. I use MER to confirm that the entire motion is turning into profitable revenue. This balance keeps me from chasing short-term ROAS at the expense of long-term demand that later shows up in MER.
Benchmarks and planning with lag
For B2B services with gross margins around 60-75 percent, a healthy MER often sits between 4 and 8. Under 3 is a warning sign that efficiency issues are eating margin. The right target depends on margin, sales cost, and payback expectations. Some sources cite MER targets of 5.0 or higher, but your margin and sales model should set the real guardrails.
A simple target. Target MER equals 1 divided by target marketing percent of revenue. If I want marketing and ad spend to be 15 percent of revenue, my target MER equals 1 divided by 0.15, which is roughly 6.7. I sanity-check that target against gross margin and sales capacity so payback stays within the bounds the business can carry.
Backing into spend from a revenue goal. If my next-quarter revenue target is 3,000,000 and my target MER is 6, planned ad spend would be about 500,000 during the period, assuming timing aligns and the sales cycle fits the quarter. If the sales cycle is 90-120 days, I shift to a rolling window so spend this quarter maps to revenue that matures next quarter.
For long sales cycles, I benchmark MER on both a rolling 90-day and 180-day view. I keep a clean note on when revenue is recognized so finance and marketing speak the same language.
How I raise marketing efficiency without hurting pipeline
Raising MER is not only about cutting spend. It is about smarter, cleaner throughput.
- Tighten the ideal client profile and the offer. Speak to a clear buying trigger, not a vague pain.
- Improve conversion on core pages. Clarify navigation, add proof, remove friction. Focus on demo, consultation, and proposal flow.
- Enrich forms slightly to filter poor-fit leads. Company size, industry, and timeline help the sales team avoid time sinks.
- Speed up sales follow-up. Independent studies, including work cited by Harvard Business Review and the Lead Response Management study, show that contacting new inquiries within minutes increases connection and qualification rates severalfold.
- Test high-intent content. Pricing, ROI explainers, implementation timelines, and detailed case narratives.
- Shift budget toward cohorts with the highest lifetime value and cap payback at 6-9 months. If a channel cannot meet that, I adjust the offer or cut spend.
- Budget allocation rule of thumb: 60 percent to proven channels that feed SQLs, 30 percent to scale candidates with line-of-sight to payback, and 10 percent to new tests. I rebalance monthly.
Privacy changes and limited cookies reduce click-path clarity. That makes MER more important as a north star while I test creative and audiences that do not attribute perfectly.
Attribution that respects B2B reality
My measurement stack blends three layers: blended MER reporting, platform-level ROAS, and CRM pipeline tracking. Each layer has blind spots; together they are practical.
Clarify ROI vs MER. ROI covers total return on total costs, including salaries, tools, and overhead. MER is revenue to ad spend only. Both are useful; they answer different questions.
- Weekly: blended MER, pipeline created, SQL count, and payback trend.
- Monthly: channel and campaign ROAS, cost per SQL, and creative winners; then I reallocate budget.
- Quarterly: run incrementality checks and compare models; use holdouts when possible.
I spot underperformers early with simple tells: rising CAC payback, falling SQL rate from a channel, more ghosted demos, and more post-demo no-shows. These often appear before revenue drops on the dashboard.
Tactics that help with offline and long-cycle attribution: I add self-reported attribution on forms and tag responses in the CRM. I track first conversations and capture clean UTMs from forms and emails. I use post-purchase surveys to capture the real source of influence, not just last click. I also compare models. Media mix modeling gives a broad view; multi-touch models help day to day. Neither is perfect, which is why MER and ROAS together are the practical fix.
From metrics to revenue: examples and guardrails
Metrics are not the goal. Revenue and margin are. I map MER and ROAS to CAC, payback, LTV-to-CAC, and gross margin so the whole team speaks one language.
Example scenario. I want a 1,200,000 ARR uplift. Average contract value is 60,000. I need 20 net new clients. With a target LTV-to-CAC of 3:1 and payback under nine months, the allowable CAC per client is about 20,000. If win rate from SQL is 25 percent, I need roughly 80 SQLs. I work backward to cost-per-SQL targets by channel, then I check whether my historical ROAS and MER can support it.
MER-to-spend mapping. If my target MER is 6 and I expect to recognize 100,000 in new monthly revenue after lag, current month spend can sit near 16,000-18,000. If I planned to spend 200,000 a month at MER 6, I would be anchoring to about 1,200,000 in monthly revenue, which is a different story entirely. The point is simple: I tie spend to lag-adjusted revenue, not the other way around.
Sustainable growth. I do not chase short-term ROAS and starve the top of funnel. I balance ROAS winners with awareness plays that lift branded search and direct traffic, which later show up in MER. I also watch sales capacity. If I add spend faster than the team can handle demos and proposals, MER will wobble for a quarter, then crash. That is not a media problem; it is a people and process limit.
Multichannel impact. Digital and traditional can work together. Podcasts, events, and sponsorships often boost search and social performance over time, which lifts MER even when ROAS looks modest in the short term. I keep an eye on geo patterns, branded search growth, and close-rate shifts among influenced accounts.
- Q: How is MER calculated? A: Total revenue divided by total ad spend for the same period. Example: 900,000 revenue on 150,000 ad spend equals MER 6.0.
- Q: What is a good MER for B2B services? A: With gross margins around 60-75 percent, MER between 4 and 8 is commonly healthy. Under 3 signals an efficiency issue. Targets should reflect margin, sales cost, and payback.
- Q: How is ROAS calculated? A: Attributed revenue divided by ad spend for that channel or campaign. Example: 50,000 revenue on 10,000 spend equals ROAS 5.0. Conversion rate and average deal size drive this.
- Q: When should I use MER vs ROAS? A: MER for budget planning, guardrails, and reporting; ROAS for daily channel and creative moves; both for quarterly rebalancing.
- Q: What distinguishes ROI from MER? A: ROI includes all costs; MER is revenue to ad spend only.
- Q: How long until MER reflects true performance? A: Typically one to three sales cycles. If the cycle is 90 days, March’s MER will be clearer by June. I track rolling 90- and 180-day MER to smooth the lag.
I can live with the tension between MER and ROAS. One number keeps me honest at the business level. The other keeps my hands on the right knobs day to day. I keep the weekly scorecard simple, respect lag, and the rest gets easier.




.svg)