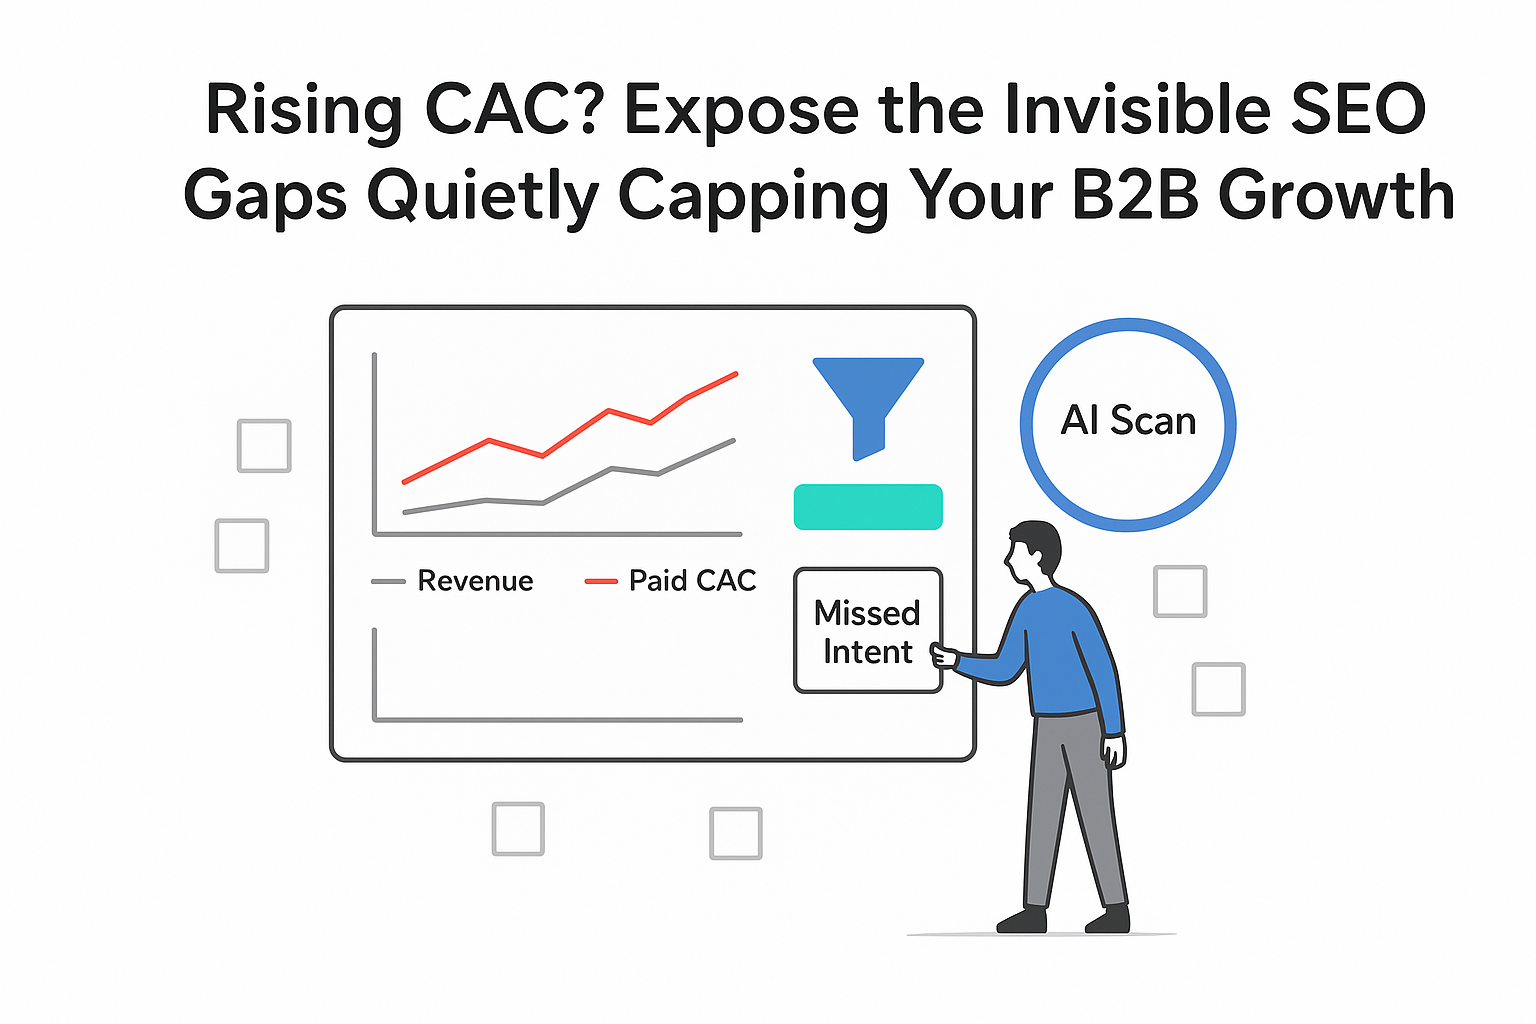
You care about growth, not vanity charts. If you’re a B2B service leader, you’re likely asking a simple question that hides a complicated answer: how to measure SEO performance in a way that connects to pipeline and revenue. The good news is, you can. The trick is to anchor measurement to business outcomes first, then use classic SEO metrics as supporting actors. Traffic matters, but revenue is the proof.
Revenue-first SEO measurement
Measuring SEO performance starts with a mindset shift. Instead of chasing rankings and sessions, lead with revenue-centric KPIs your finance team already recognizes: pipeline value, closed-won revenue, sales-qualified leads (SQLs), and demo requests. Those are the anchors. Then connect search signals to sales outcomes with a clear KPI tree:
- Rankings and SERP visibility influence impressions and click-through rate (CTR)
- Clicks drive sessions and engaged sessions
- Sessions lead to conversions like demo requests or qualified form fills
- Conversions become SQLs
- SQLs become pipeline and, with time, closed revenue
That tree prevents a common trap: traffic without conversions doesn’t pay the bills. Yet ignoring traffic trends makes you slow to spot early gains or early warnings. Use both - revenue first, traffic second.
To make this work in a real sales org, segment KPIs three ways:
- By market or region when sales coverage differs
- By service line or solution, to fund winners and fix laggards
- By intent stage (informational, comparison, purchase keywords)
A practical example: track demo requests and SQLs for a cybersecurity service line in the US sourced from non-brand organic and compare it to the UK line. If the US trend shows strong non-brand growth but the UK is flat, you know where to push content and where to revisit positioning.
Revenue is affected by more than SEO - pricing shifts, inventory or resource constraints, seasonality, and macro demand can skew numbers. That doesn’t mean you avoid revenue KPIs. It means you also keep proxy KPIs that explain the story underneath and review how they connect in the tree every month.

SEO ROI that finance trusts
Keep the formula simple so everyone aligns on the math:
ROI = (Organic-sourced revenue − Total SEO cost) / Total SEO cost
If the pipeline runs long, use weighted pipeline by stage probability to estimate near-term value. A stage with 25% close probability counts as 0.25 of its value, not the full number. That keeps forecasts realistic.
Attribution sparks debate, so don’t pick one view. Check three:
- First touch to see how SEO starts journeys
- Last touch to show where conversions close
- Position-based to split credit across the path
In analytics, assisted conversions and model comparison help triangulate channel impact. Add cohort analysis to confirm whether last quarter’s organic-sourced leads are converting into pipeline at the expected rate. Also check payback period by pairing closed revenue with total monthly SEO cost. In many B2B service models, a sub-12-month payback is healthy, but calibrate targets to lifetime value and margin profile.
One essential step completes the loop: import offline conversions from the CRM into analytics so later-stage events (e.g., opportunity created, proposal sent, closed-won) flow back to the channel that initiated the journey. The ROI picture sharpens with every sync. If you use GA4, make sure you set up key events meaningful for your business.

CAC and LTV:CAC for organic search
Customer acquisition cost (CAC) shows how much you spend to win one new customer from organic search:
CAC = Total SEO spend / New customers from organic
Total spend should include content production, technical development, analytics and infrastructure, headcount, and outside support. If you exclude real costs, the number looks optimistic and misleads budgeting. Because SEO revenue often trails work by weeks or months, use a 3-6-month rolling average to smooth volatility.
Then pair CAC with LTV:CAC. If lifetime value is around five times SEO CAC, that’s a strong signal. If it sits under three, tighten targeting, refresh conversion points, or revisit lead qualification. Keep context: one enterprise deal can swing monthly CAC, so the rolling view avoids false alarms. For a deeper framework on quantifying outcomes, see this perspective on the ROI of SEO.
Rankings that map to demand
Rankings still matter, but not on their own. Track them by topic clusters tied to buying intent, not a random list of head terms. That means grouping keywords by themes like SOC consulting or cloud cost reduction, then watching visibility across the whole cluster. If a cluster rises, the strategy is working even if one marquee term bounces.
Also weight positions by revenue potential and SERP clickability. A number-one listing under a map pack, videos, and AI Overviews may attract fewer clicks than a number-three in a clean SERP. Including share of voice shows how much of the top ten you occupy across a cluster. Check zero-click search dynamics and audit your visibility on SERPs right now. For ongoing tracking across engines and devices, use a rank-tracking source like the Semrush Position Tracking tool.
AI Overviews and answer engines add a new twist. Track whether pages are cited in AI results and whether those answers reduce clicks. In search analytics, watch impressions, clicks, CTR, and average position for each cluster. When impressions rise but clicks lag, you may be facing a click squeeze from SERP features. The playbook:
- Strengthen titles and meta descriptions to earn the click
- Win and defend featured snippets with succinct summaries near the top
- Add FAQ schema and concise answers to common questions
- Clarify page structure so extraction and summaries favor your content
And a quick note that can look contradictory: rankings can improve while traffic dips. Seasonality, SERP changes, and shifting user behavior cause that. Check the KPI tree and share of voice before you panic - the fuller picture is usually calmer.
Brand vs non-brand is your net-new indicator
If you don’t split brand and non-brand, you can’t tell whether SEO is creating net-new demand. In search analytics, filter out queries that include the brand and product names and report the non-brand share of clicks, impressions, and conversions. Start with Google Search Console and complement with a third-party view like Semrush to validate market-level trends.

Two baselines help you stay honest:
- Non-brand share of clicks as a percentage of organic clicks
- Non-brand conversions as a percentage of organic conversions
Aim for steady growth in both. One caveat: some industries see heavy brand clicks from existing customers who just want to log in. That’s fine - keep the split, and use the non-brand trend as the north star for acquisition reporting.
Clean data and a minimal stack to tie search to sales
You don’t need an endless stack to measure with discipline, but you do need the essentials connected:
- Search analytics for queries, CTR, and index coverage - for example, Google Search Console
- Web analytics for channels, engagement, conversions, and attribution views - e.g., Google Analytics
- A rank-tracking source for clusters, share of voice, and SERP features
- A CRM for pipeline stages and closed revenue, plus offline conversion imports so analytics reflects later-stage outcomes
- Call tracking if phone leads matter
- A reporting layer to blend search, web, and CRM data into one view the team reviews monthly
- Emerging signals: AI referrals (as a custom channel) and AI visibility tracking for citations in major models - tools like Semrush Enterprise AIO can help
Quality assurance keeps numbers trustworthy. Verify source/medium tagging, confirm that key events are marked as conversions, and ensure cross-domain settings are correct. A 30-minute QA each month prevents hours of debate later. If you’re configuring GA4, use Google’s guidance to set up key events meaningful for your business. Budgeting stays sane when you focus on outcomes: people turning insights into action usually drive returns more than adding another tool.
Pitfalls to avoid and a simple monthly cadence
A lot can go sideways. The most common reporting mistakes in B2B programs - and what to do instead:
- Chasing vanity metrics while ignoring pipeline
- Fix: lead with SQLs, pipeline value, and closed-won; place traffic below them
- Not separating non-brand from brand
- Fix: maintain saved views for both and show two trend lines in every executive read-out
- No CRM tie-in
- Fix: connect analytics and CRM, map source/medium/campaign to opportunity records, and import offline conversions
- Ignoring assisted conversions and multi-touch
- Fix: review model comparison monthly and include assisted conversions by channel
- No baseline or seasonality control
- Fix: snapshot the last 12-24 months, mark seasonal peaks, and use rolling averages
- Measuring only volume, not quality
- Fix: segment organic leads by qualification, win rate, and deal size in the CRM
- Neglecting AI and SGE visibility
- Fix: track AI citations and CTR shifts on impacted pages; adjust summaries and snippets accordingly. For broader context, consider the value LLM search will likely represent.
Keep the operating rhythm simple so insights turn into decisions:
Month 0 baseline
- Audit analytics events and mark business actions (demo requests, trial starts) as conversions
- Ensure all verified properties and sitemaps are covered in search tooling like Google Search Console
- Map CRM fields for lead source, subchannel, and campaign; sync to analytics
- Snapshot the KPI tree with current numbers as a “before” picture
Months 1-2 setup
- Build a single dashboard blending search, web analytics, rank tracking, and CRM pipeline
- Create saved views for non-brand and brand query sets
- Define topic clusters in the rank tracker with share of voice and SERP feature tracking - tools like the Semrush Position Tracking tool help
- Add AI referral tracking as a custom channel if relevant
Monthly rhythm
- Review revenue KPIs first: SQLs, pipeline value, and closed-won from organic
- Check CAC and LTV:CAC on a rolling window
- Scan KPI-tree friction points: low CTR on pages with strong impressions, high drop-off on key journeys
- Convert insights to actions: refresh content, add bottom-funnel pages, strengthen internal links, fix page speed, and earn authoritative coverage where it moves the needle
Quarterly reforecast
- Update weighted pipeline and ROI with current close rates
- Adjust topic clusters based on wins, gaps, and TAM learnings
- Revisit attribution views to see whether SEO is starting more journeys than it finishes, then tune content to match
One last signal to watch: SEO often improves other channels. When organic content educates prospects, paid search conversion rates climb, direct traffic grows, and sales cycles shorten. Monitor blended CAC and paid search costs alongside organic engagement. If blended CAC drops while organic engagement rises, SEO is doing the quiet work you want to keep funding.
This system isn’t flashy, but it answers the question that matters in every board packet and budget meeting: how to measure SEO performance in a way that proves value, guides action, and sustains growth without headaches.


.svg)