
Google CTR redistribution in Q3 2025 across branded, commercial, and long-tail queries
This report summarizes Q3 2025 Google organic click-through rate (CTR) trends reported by Advanced Web Ranking (AWR) and surfaced via Search Engine Journal (SEJ). It highlights how clickshare shifted by intent (branded, commercial, local), query length, device, and industry between Q2 (April–June) and Q3 (July–September) 2025.
The dataset is international rather than country-specific, so it reflects broad global patterns rather than local markets. The central question: when rankings stayed constant, where did user clicks move during Q3 2025, and which segments became more or less efficient at sending traffic?

Executive snapshot
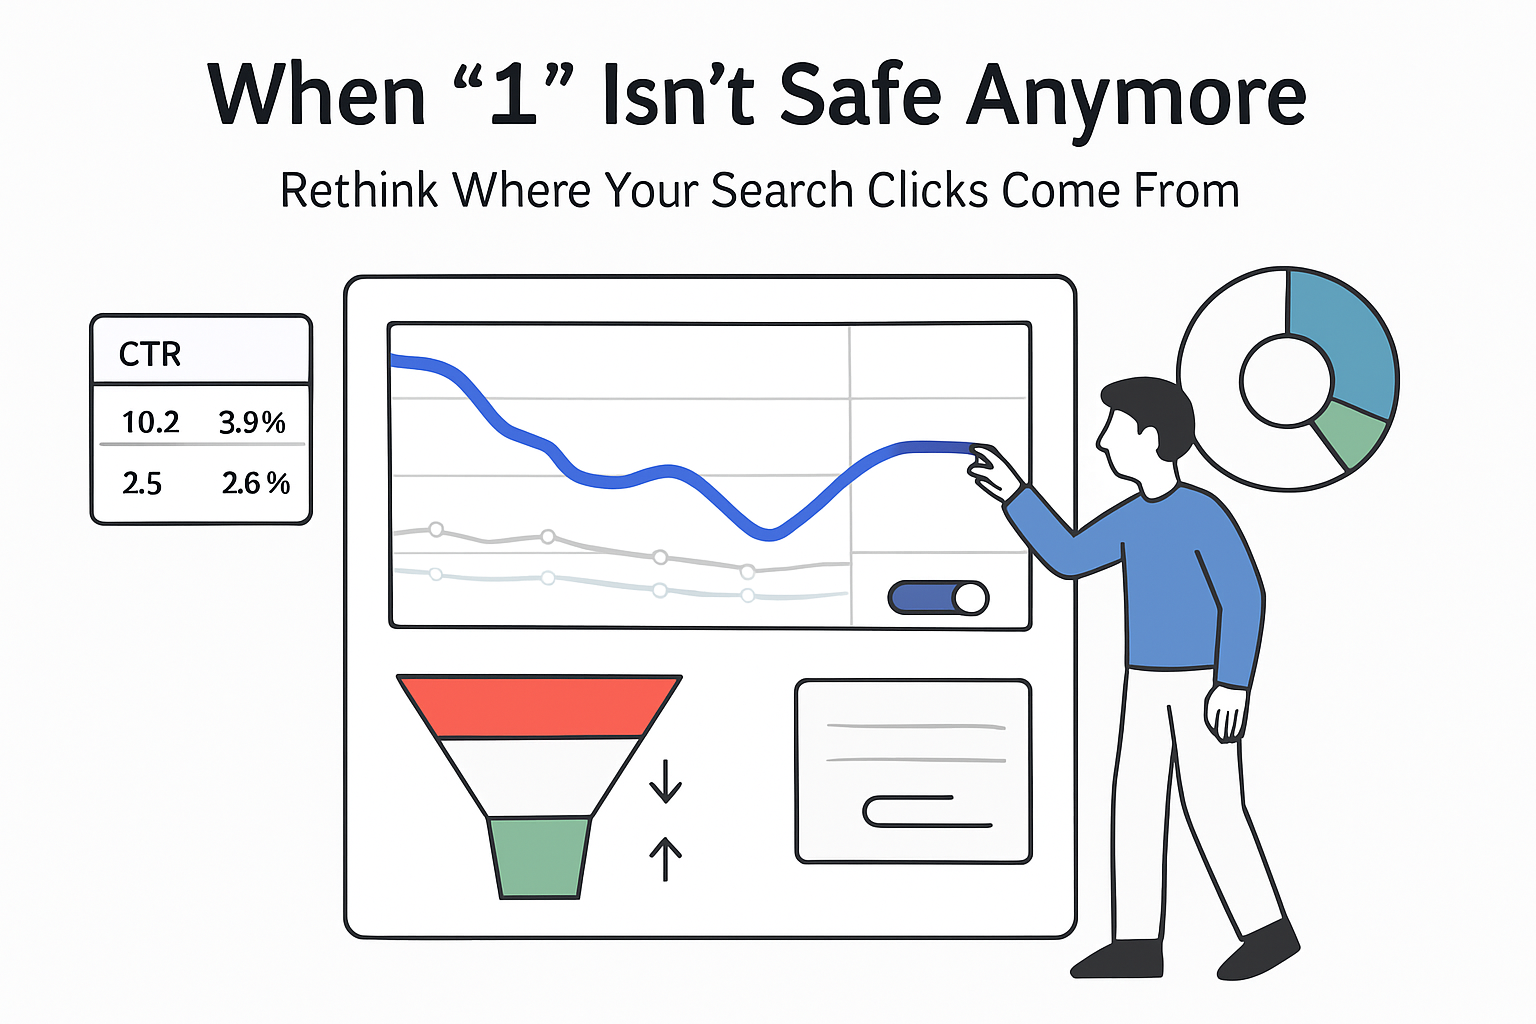
- Branded desktop searches: position 1 lost 1.52 percentage points of CTR, while positions 2–6 together gained 8.71 points, indicating more distributed clicks across the first page for brand terms. [S1]
- Commercial desktop queries: positions 1 and 2 together lost 4.20 CTR points, with position 1 alone down 3.01 points. [S1]
- Location (local intent) queries: position 1 CTR dropped 2.52 points on desktop and 2.13 points on mobile versus Q2. [S1]
- Query length: on desktop, 2-word and 3-word searches saw roughly 1.2-point CTR drops at position 1, while 4+ word queries were flat; on mobile, 1-word searches gained 1.52 points at position 1. [S1]
- Industries: Arts & Entertainment desktop position 1 fell 5.13 points; Travel’s desktop position 2 gained 2.46; in Shopping, desktop position 1 fell 2.10 points while positions 2 and 3 gained a combined 2.83 points. [S1]
Implication for marketers: even when rankings hold, traffic from commercial, local, and short generic desktop queries is becoming less predictable, while clicks are spreading across more positions for branded and some shopping queries.
Google CTR trends in Q3 2025: method and source notes
The primary data comes from Advanced Web Ranking’s Q3 2025 Google organic CTR study, which tracks average click-through rate by organic position across query types, intents, devices, and industries. SEJ’s coverage summarizes the key shifts between Q2 2025 (April–June) and Q3 2025 (July–September) based on that dataset. [S1] For full charts and methodology, see AWR’s Q3 2025 CTR clickthrough report.
AWR’s report is described as international rather than focused on a single country or language, so results reflect a blended global search pattern. [S1] The study groups queries by:
- Brand vs non-brand
- Intent: informational, commercial (for example, “buy”, “price”), and location (local intent)
- Query length (1 word, 2 words, 3 words, 4+ words)
- Industry vertical (18 categories such as Arts & Entertainment, Travel, Shopping)
The available data in [S1] reports changes in CTR (percentage-point deltas) by position rather than full, absolute CTR curves for each segment. AWR does not attribute specific causes for changes but notes that commercial and local SERPs often contain rich results and modules that compete with organic listings. [S1]
Key limitations
- Exact sample size, keyword mix, and site composition for Q3 2025 are not specified in [S1].
- Results are averages; individual sites, countries, and SERP configurations can differ materially.
- The study tracks organic positions only; it does not quantify clicks absorbed by ads, maps, or other modules.
- Data is period over period (Q2 vs Q3 2025); it does not show multi-year trends for these exact segments.
Sources
- [S1] Search Engine Journal, Matt G. Southern, “Google CTR Trends In Q3: Branded Clicks Fan Out, Longer Queries Hold,” summarizing AWR’s Q3 2025 CTR report.
- [S2] Advanced Web Ranking, Q3 2025 Google Organic CTR report (primary dataset referenced in [S1]).
- [S3] Sistrix, “Update: Google Click-Through Rates in 2020,” long-running study on CTR by position and device, used here for historical context.
Findings on organic click-through rate by query type and device
Branded vs unbranded queries
- For searches that include a brand or business name on desktop, position 1 CTR declined by 1.52 percentage points in Q3 vs Q2. [S1]
- Desktop positions 2–6 for branded queries together gained 8.71 CTR points, indicating a redistribution of branded clicks down the page. [S1]
- SEJ notes that “unbranded queries were mostly unchanged,” suggesting this redistribution is specific to branded desktop SERPs rather than a universal pattern. [S1]
Commercial and location intent
- Commercial desktop queries (for example, containing “buy”, “price”) saw combined CTR for positions 1 and 2 fall by 4.20 points. Position 1 alone lost 3.01 points, implying a smaller but meaningful drop for position 2. [S1]
- Location intent queries show weakening of the top spot on both form factors:
- Desktop position 1: -2.52 CTR points vs Q2
- Mobile position 1: -2.13 CTR points vs Q2 [S1]
SEJ highlights that these are the kinds of SERPs “where rich results and other modules can crowd the page,” although the underlying report does not assign direct causation. [S1]
Query length and device
- On desktop, position 1 CTR declined for shorter multi-word searches:
- 2-word queries: -1.22 points at position 1
- 3-word queries: -1.24 points at position 1 [S1]
- AWR notes that 4+ word queries were the only length group with steady position 1 CTR in Q3. [S1]
- On mobile, the direction is different for the shortest queries:
- 1-word searches saw position 1 CTR increase by 1.52 points. [S1]
This pattern leaves short, generic desktop searches as the most volatile category in terms of CTR change, while longer desktop queries and very short mobile queries appear more stable or improving at the top position. [S1]
Industry-level Google CTR patterns in Q3 2025
AWR’s data, as summarized in [S1], shows uneven CTR shifts across 18 industries, with movement concentrated in a few verticals.
Arts & Entertainment
Desktop position 1 experienced the steepest single-position decline of any vertical at -5.13 CTR points vs Q2. [S1]
Travel
Travel recorded the strongest gain, with desktop position 2 up 2.46 CTR points. [S1] The report does not specify the corresponding change for position 1, but the emphasis on position 2 implies a redistribution within the top results rather than simple growth in total organic clicks.
Shopping (retail-oriented queries)
- Desktop position 1 CTR fell by 2.10 points. [S1]
- Desktop positions 2 and 3 together gained 2.83 CTR points, indicating a shift of clicks from the very top listing to other high-ranking organic results. [S1]
The industry data shows that CTR changes are not uniform. Some segments face sharper top-spot compression (Arts & Entertainment, Shopping), while others (Travel) see gains slightly lower on the page. AWR ties these patterns to demand trends, but specific demand metrics (search volume changes, seasonal effects) are not quantified in [S1].
Interpretation and implications for SEO and PPC strategy
Branded desktop queries: multiple listings matter more (Likely)
Given the 1.52-point drop at position 1 and 8.71-point combined gain across positions 2–6 for branded desktop queries, it is likely that users increasingly click a broader mix of brand-related results, including homepages, subpages, social profiles, and review sites, rather than defaulting to the first organic listing. [S1] Marketers should prioritize controlling and optimizing several prominent branded assets (site links, support pages, store locators, key profiles) rather than focusing solely on the top result.
Commercial and local: top-spot value is shrinking (Likely)
The 3.01-point drop for commercial desktop position 1 and the 2.52/2.13-point drops for location queries at position 1 on desktop and mobile indicate that the incremental advantage of ranking first in these SERPs is shrinking. [S1] It is likely that richer layouts (ads, map packs, product cards) continue to siphon attention from organic position 1 in commercial and local contexts. Budget and performance models that still assume “position 1 = maximum practical share of clicks” in these segments need updating.
Short vs long queries: long-tail remains a steadier traffic source (Likely)
With 2- and 3-word desktop queries losing roughly 1.2 CTR points at position 1 while 4+ word queries hold steady, it is likely that long-tail content continues to provide more stable organic traffic over time. [S1] This supports content strategies that invest in specific, intent-rich phrases (4+ words) rather than relying mostly on broad, short-head desktop keywords for sustained traffic.
Device split: mobile brand/navigation behavior (Tentative)
The 1.52-point gain for 1-word mobile queries at position 1 suggests that some mobile users are clicking the first result more decisively on ultra-short searches, many of which are single-word brands or generic navigational terms. [S1] It is tentative but reasonable to treat mobile position 1 for single-term brand queries as slightly more resilient to SERP clutter than the desktop equivalent.
Vertical strategy and forecasting (Tentative)
For Arts & Entertainment and Shopping, the significant declines at desktop position 1 imply that traffic forecasting based on older CTR curves may now overestimate the benefit of top rankings. [S1] In Travel, the gain at position 2 indicates that visibility just below the top spot can still drive meaningful volume. [S1] It is tentative but practical to adjust models and revenue projections by vertical: reducing expected lift from rank-1 improvements in Arts & Entertainment and Shopping, and assigning more value to rank-2 visibility in Travel.
Organic-paid mix in commercial and local SERPs (Speculative)
Because AWR’s data does not include paid clicks, it is speculative but plausible that some of the lost organic CTR at the top in commercial and local SERPs is captured by paid placements and rich modules. If that is true in your market, increasing reliance on paid search or local ads for highly commercial or strongly localized terms may be necessary to maintain total click volume, even if organic rankings remain strong.
Contradictions and gaps in the Q3 2025 CTR data
Lack of absolute CTR baselines
AWR’s Q3 2025 data, as reported by SEJ, focuses on changes in CTR, not full CTR percentages by position for each segment. [S1] Without absolute baselines, it is difficult to quantify, for example, whether a 3-point drop from position-1 commercial CTR is a fall from 30% to 27% (10% relative decline) or from 20% to 17% (15% relative decline). This limits the precision of traffic and revenue modeling.
Comparability with other CTR studies
Historical data from Sistrix has shown desktop position-1 CTRs around the high-20% range for generic queries in earlier years. [S3] Those curves already reflected erosion due to SERP features. Because AWR’s current numbers are deltas rather than absolute values, direct comparison with Sistrix or older AWR curves is not straightforward, and businesses should treat cross-study comparisons as approximate.
Causation vs correlation
While SEJ notes that commercial and local SERPs are crowded with rich results, the AWR report does not document which specific SERP features were present on the pages in question. [S1] As a result, assigning causation (for example, “map packs caused X% of CTR loss”) is not possible from this data alone.
Segment granularity
The dataset groups queries into broad intents and industries, but does not break out:
- Brand vs non-brand within each industry
- Desktop vs mobile splits per vertical for every position
- Changes by SERP feature presence (for example, product listings, video carousels)
These gaps mean individual sites may see patterns that differ significantly from the global averages, especially in niche markets or regions not well represented in the aggregated data.
Data appendix: summarized CTR deltas from Q2 to Q3 2025
The table below consolidates the explicit percentage-point changes mentioned in SEJ’s summary of AWR’s Q3 2025 CTR report. All values are relative changes in CTR at the specified position vs Q2 2025. [S1]
| Segment / Query type | Device | Position(s) | CTR change (percentage points) |
|---|---|---|---|
| Branded queries | Desktop | Pos 1 | -1.52 |
| Branded queries | Desktop | Pos 2–6 (combined) | +8.71 (combined) |
| Commercial intent | Desktop | Pos 1 | -3.01 |
| Commercial intent | Desktop | Pos 1–2 (combined) | -4.20 (combined) |
| Location intent | Desktop | Pos 1 | -2.52 |
| Location intent | Mobile | Pos 1 | -2.13 |
| 2-word queries | Desktop | Pos 1 | -1.22 |
| 3-word queries | Desktop | Pos 1 | -1.24 |
| 4+ word queries | Desktop | Pos 1 | ~0 (steady) |
| 1-word queries | Mobile | Pos 1 | +1.52 |
| Arts & Entertainment vertical | Desktop | Pos 1 | -5.13 |
| Travel vertical | Desktop | Pos 2 | +2.46 |
| Shopping vertical | Desktop | Pos 1 | -2.10 |
| Shopping vertical | Desktop | Pos 2–3 (combined) | +2.83 (combined) |
These figures should be treated as directional indicators of how user behavior shifted between Q2 and Q3 2025 across major query types and verticals, not as precise CTR forecasts for any individual site or SERP.


.svg)

.svg)
.svg)