
Mobile landing pages underperform desktop by a measurable margin, even as mobile drives the majority of visits. In a platform-wide analysis of 41,000 landing pages and 57 million conversions, Unbounce’s Conversion Benchmark Report finds that plain-language copy and email traffic correlate with the strongest conversion rates. This brief highlights the numbers marketers can use to set targets and prioritize fixes.

Mobile landing page conversion gap - Executive snapshot
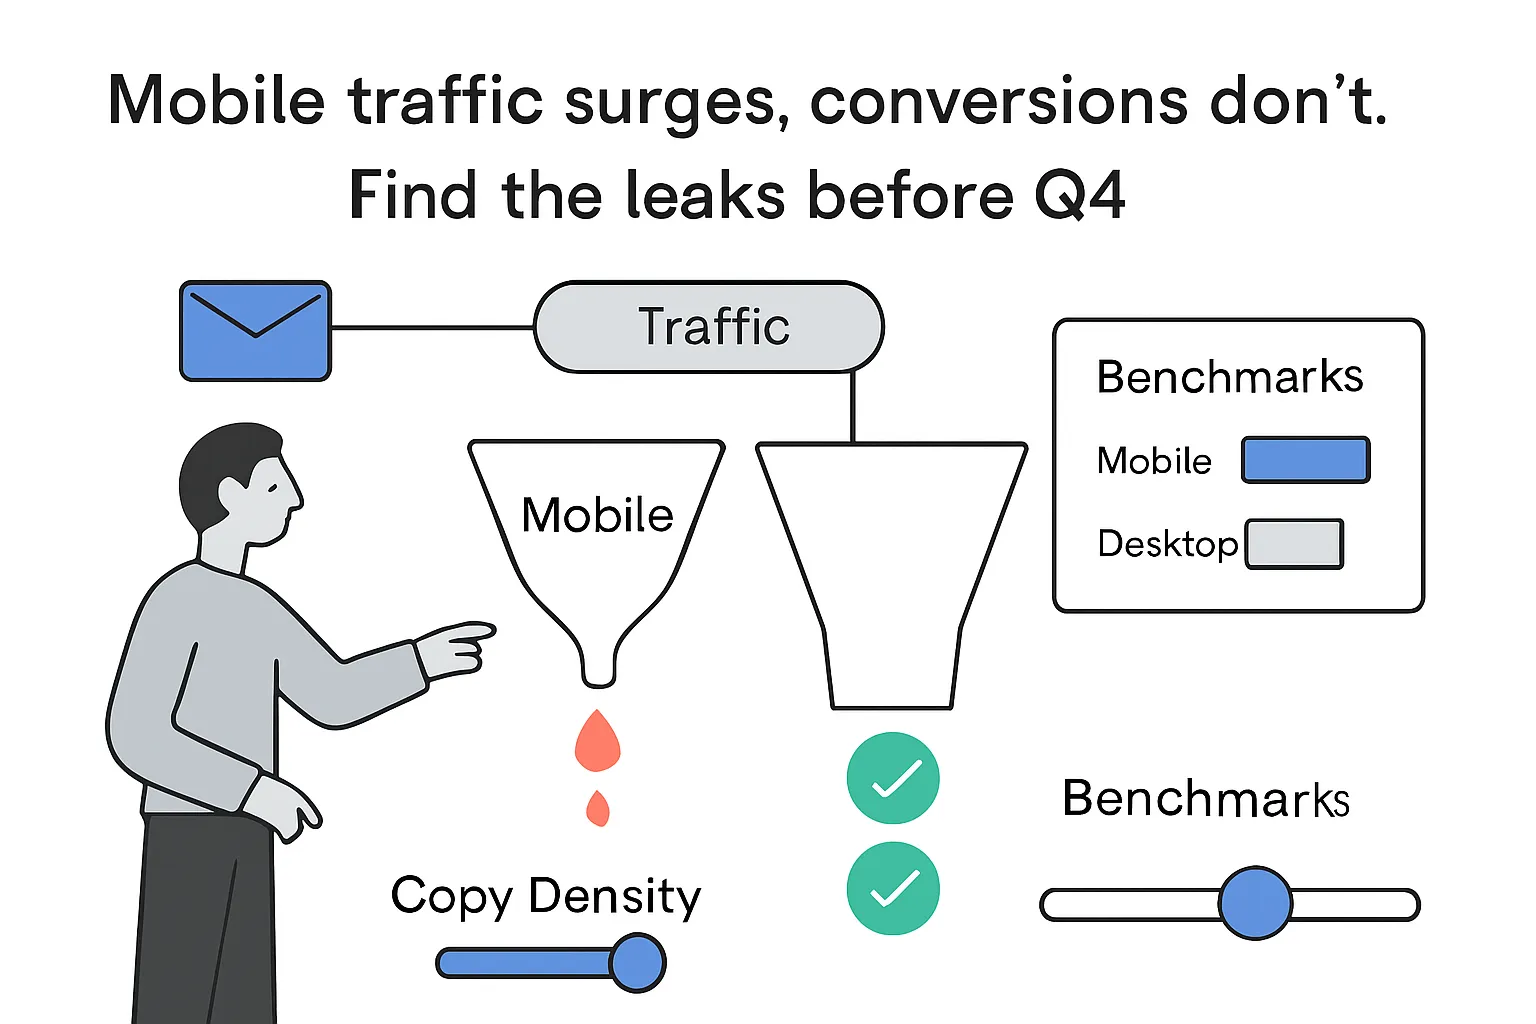
- 83% of landing page visits came from mobile devices, yet desktop converted 8% higher on average.
- Median landing page conversion rate across industries: 6.6% with verticals ranging from 3.8% to 12.3%.
- Pages written at a 5th-7th grade reading level converted at 11% - 56% higher than pages at an 8th-9th grade level. Heavy use of complex words (3+ syllables) correlated with a 24.3% drop in conversion.
- Email traffic averaged a 19.3% conversion rate. Paid social also performed strongly (Instagram 17.9%, Facebook 13%) and outpaced paid search in this dataset.
- Closing the 8% mobile gap would have yielded an estimated 1.3 million additional conversions in the sample.
Implication for marketers: Treat mobile as the primary experience, simplify language to a 5th-7th grade reading level, and capture demand with email and paid social while monitoring conversion quality.
Method and source notes
What was measured: Unbounce aggregated anonymized performance from 41,000 landing pages and 57,000,000 conversions across industries to report device mix, conversion by device, channel-level conversion averages, and copy readability correlations. The report presents medians and ranges and estimates lost conversions from the mobile-desktop gap.
Timing and scope: The exact time window is not specified. Results reflect pages and traffic processed on Unbounce’s platform and may over-represent mobile-heavy acquisition programs, such as social ads.
Supplementary evidence
- Mobile speed and bounce: Google/SOASTA found that slower mobile load times sharply increase bounce probability - 1 to 3s: +32%, 1 to 5s: +90%, 1 to 10s: +123% (source).
- Speed and conversion: Deloitte observed that a 0.1s improvement in mobile site speed correlated with an 8-10% lift in conversions in retail and travel (source).
- Device share baseline: StatCounter shows mobile at roughly 59-61% of global web traffic in 2024, lower than the 83% share seen on landing pages in the Unbounce dataset (source).
Key limitations
- Conversion definitions vary by campaign and are set by advertisers. Not all conversions carry equal revenue impact.
- Channel conversion rates may reflect audience warmth and do not isolate causal effects.
- Readability findings are correlational and may proxy for audience, offer type, or compliance context.
Findings
Mobile vs. desktop performance
- Traffic mix: 83% of landing page sessions were on mobile devices, indicating mobile-heavy acquisition on landing pages. This exceeds the ~59-61% global mobile share, suggesting selection effects from ad and social traffic.
- Outcome: Desktop converted 8% better than mobile on average despite far less traffic volume. Unbounce estimates 1.3 million incremental conversions were possible if pages closed this gap.
- Speed context: Independent studies tie slower mobile load times to sharp increases in bounce and lower conversion. A 1 to 5 second delay raises bounce probability by 90% (Google/SOASTA), and a 0.1s improvement correlated with an 8-10% conversion lift in retail and travel (Deloitte).
Industry medians and spread
- Aggregate median conversion rate: 6.6% across all industries.
- Verticals span 3.8% to 12.3%, so targets should reflect category and conversion type, not a single global number.
- Frequency is not value. High rates may be tied to low-friction micro-conversions, while lower rates may represent higher-value goals.
Readability and copy simplicity
- Pages at a 5th-7th grade level converted at 11% on average - 56% higher than pages at an 8th-9th grade level, and more than double professional-level copy in this dataset.
- Use of complex words (three or more syllables) showed a 24.3% negative association with conversion rates.
- Practical take: Simplify vocabulary and sentence structure to improve form completion and call-to-action engagement, especially on small screens.
Channel performance
- Email traffic had the highest observed conversion rate at 19.3%, consistent with warmer, known audiences.
- Paid social performed well: Instagram at 17.9% and Facebook at 13%, surpassing paid search in this dataset.
- These figures are averages across many accounts and objectives; outcomes depend on offer quality, audience intent, and funnel stage.
Interpretation and implications
Likely
- Make mobile the primary design and quality assurance focus. Given the traffic share and the 8% performance gap, improving mobile speed, forms, and above-the-fold clarity is a high-leverage opportunity.
- Plain language is an actionable lift. Target a 5th-7th grade reading level in headlines, body copy, and form labels. Reduce complex words and test shorter sentences.
- Lean into email’s conversion strength with list growth and landing pages tuned for rapid confirmation (short forms, minimal friction).
Tentative
- Paid social’s strong averages suggest creative-to-page match and mobile-native layouts matter more than platform choice. Align visuals, headline promise, and landing page scannability to preserve intent.
- Use industry medians as directional targets, but pair rate goals with revenue per lead or per order to avoid over-optimizing low-value actions.
Speculative
- A material share of the mobile gap may be driven by speed debt and input friction. Combine image compression, fewer third-party scripts, and progressive disclosure in forms to recover a meaningful portion of the estimated 1.3 million missed conversions.
These findings align with broader industry trends that emphasize lean UX, continuous testing, and mobile-first optimization.
Contradictions and gaps
- Device mix variance: Landing pages show 83% mobile sessions, while global browsing is closer to 59-61% mobile. Results may not generalize to all sites or B2B contexts.
- Timeframe and causality: The measurement window is unspecified. Relationships are correlational and may be confounded by offer type, audience, and funnel stage.
- Channel comparability: Email typically reflects warm users, while paid search and paid social often include colder audiences. Direct comparisons have limits without uniform objectives and attribution windows.
- Conversion definition: Campaign-level definitions vary. Compare rates alongside value metrics to avoid misinterpretation.
Data appendix
- Device share on landing pages: mobile 83%. Desktop converted 8% higher than mobile.
- Aggregate median conversion rate: 6.6%. Vertical range: 3.8-12.3%.
- Readability: 5th-7th grade level averaged 11% conversion and outperformed 8th-9th grade by 56%. Complex words (3+ syllables) associated with a 24.3% drop.
- Channel conversion rates: Email 19.3%; Instagram 17.9%; Facebook 13%.
- Speed context: Bounce probability rises 32% (1 to 3s), 90% (1 to 5s), 123% (1 to 10s). A 0.1s faster mobile load correlated with +8-10% conversions in retail and travel.


.svg)

.svg)
.svg)