
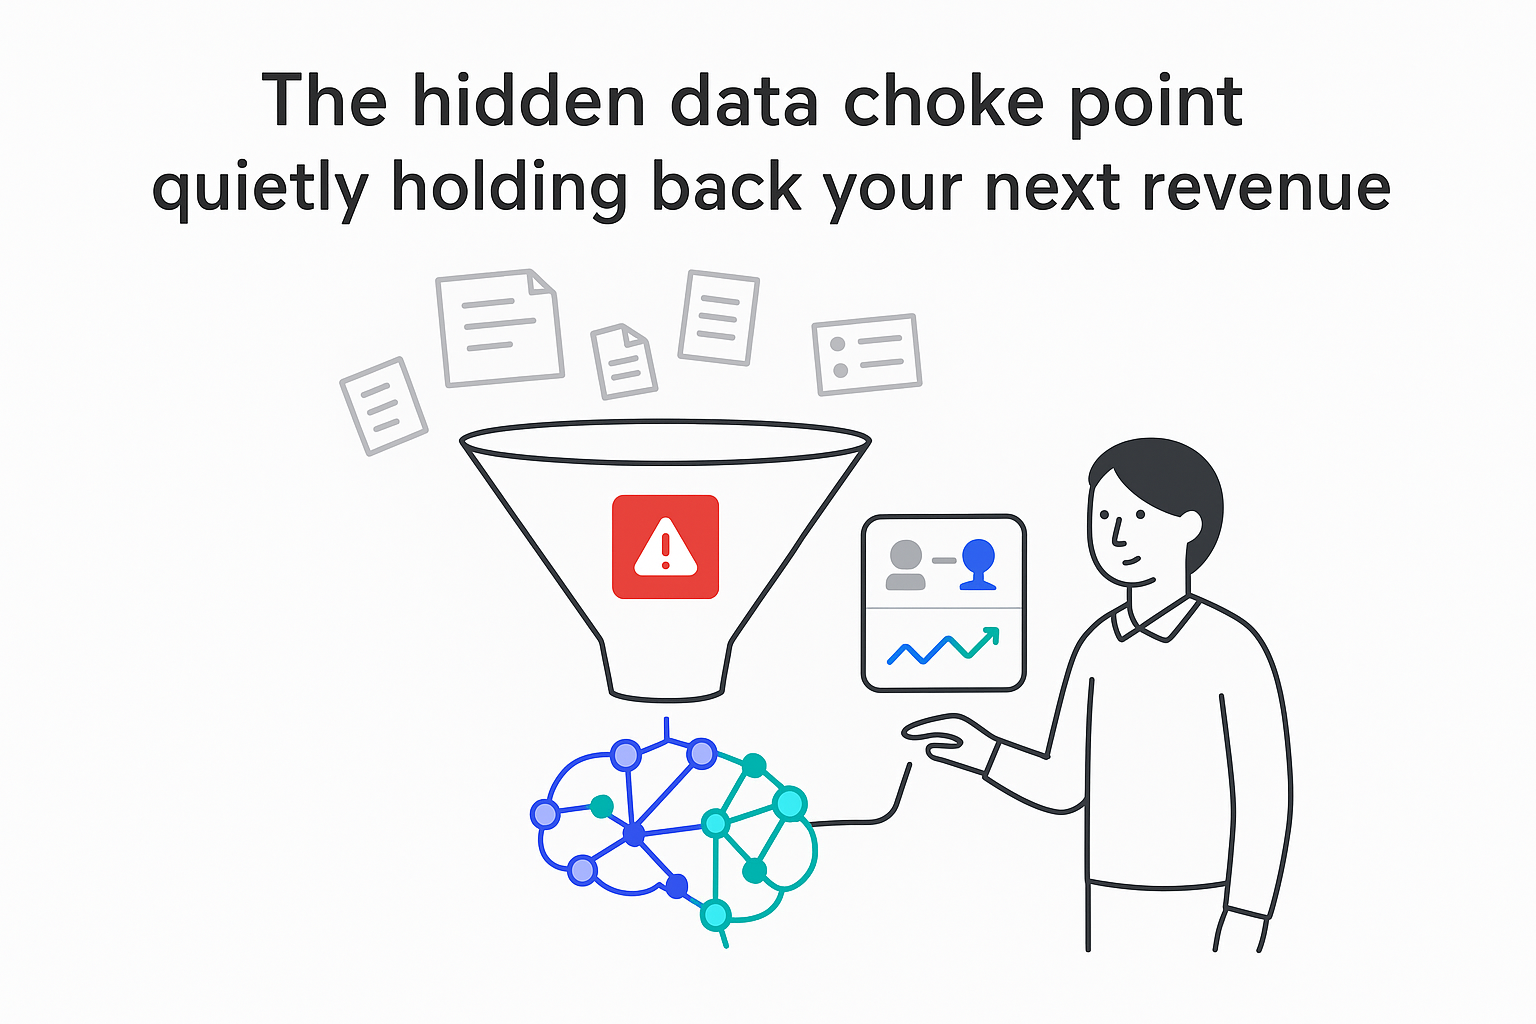
Most B2B founders I talk to do not suffer from a lack of data. They suffer from a lack of usable knowledge. Deals sit in the CRM, documents live in Drive, tickets hide in a helpdesk, and the sharpest insights still live in people’s heads. That patchwork can work early on, but it often starts to creak around the mid five-figures to low six-figures in monthly revenue - when growth begins to feel “stuck” even though activity is high.
Knowledge graphs for B2B businesses: turning scattered info into a company brain
When execution slows down in B2B service companies, the pattern is rarely “we need more tools.” It is usually that the business cannot reliably connect what it already knows: what clients bought, why they bought, which problems repeat, which deliverables actually drive outcomes, and which content assets support sales and delivery.

If you are running a B2B service company, you may recognize some of this:
- Revenue plateaus in the mid five-figure to low six-figure monthly range, even though the team stays busy.
- Paid search and outbound keep the pipeline alive, but cost per lead slowly rises.
- Sales, success, and delivery keep asking the same questions about clients, offers, and processes.
- Documentation grows, but people still interrupt subject-matter experts for “that one slide” or “that old proposal.”
I think of it as a company brain: a structured map of clients, services, problems, deliverables, content, and outcomes - linked in a way that both humans and AI systems can query.
A knowledge graph is one way to turn “we have information everywhere” into “we can answer questions consistently.”
Why knowledge graphs can become a competitive advantage in B2B services
A knowledge graph does not create value just by existing. It creates value when it reduces friction in decisions and execution: fewer repeated questions, fewer one-off analyses, fewer “tribal knowledge” bottlenecks, and more consistent answers across teams.
Here is what I typically expect a well-scoped knowledge graph to improve:
- Faster, more explainable decisions by connecting sales, delivery, and customer signals in one model (instead of scattered dashboards and anecdotes).
- Leaner knowledge sharing because people can find the right artifact (doc, deck, snippet, precedent) without asking around.
- Stronger content performance because topic coverage, internal linking opportunities, and gaps become visible when you model content as connected concepts rather than isolated pages.
- A more consistent customer experience because support and sales draw from the same underlying “source of truth,” whether the answer is delivered by a human or an AI assistant.
I also want to be clear about a hidden assumption: this helps most when your business has repeated patterns (similar problems, similar deliverables, similar segments). If every engagement is radically bespoke, the graph can still help with retrieval and governance, but the ROI tends to come from knowledge reuse rather than automation.
If you want more conceptual background before getting practical, the previous post on Medium is a useful primer.
What a knowledge graph is (and how it differs from a warehouse or a wiki)
In plain language, a knowledge graph is a map of important things in your business and how they relate.
The “things” (nodes) might be clients, industries, services, problems, documents, contacts, and outcomes like renewal or churn. The connections (relationships) might be “purchased,” “operates in,” “solves,” “is documented in,” or “is similar to.”
Where this differs from systems you already know:
A traditional database or data warehouse is excellent for structured reporting - questions you can define ahead of time (monthly revenue by segment, pipeline by stage). A wiki or knowledge base is great for reading and publishing pages. But both tend to struggle when the question is relational and multi-step, like: “Which fintech clients bought package A, had issue type B in the first 30 days, then expanded within six months - and which assets did sales use in those deals?”
A knowledge graph is designed for that kind of “follow the connections” reasoning. It keeps context intact as you move from entity to entity, which is also why it pairs well with modern AI retrieval approaches.
For a real-world example of graph thinking at scale, see LinkedIn’s public knowledge graph.
What has to exist inside an enterprise knowledge graph
You do not need to be an engineer to evaluate whether a knowledge graph is being built sensibly. I look for a few fundamentals:
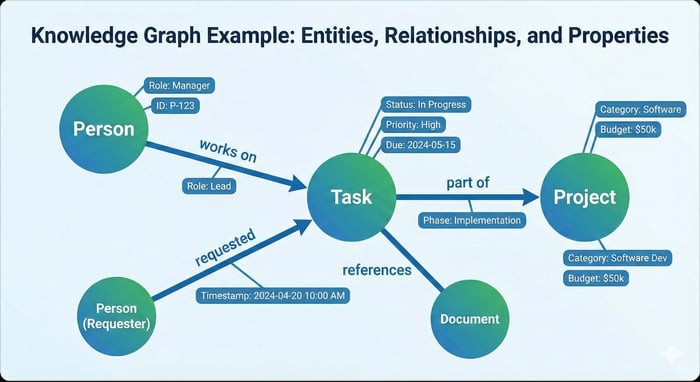
A clear set of entities and relationships. For a B2B service company, that usually includes clients and prospects, industries/segments, services and packages, use cases/problems, documents and content assets, contacts/personas, and outcomes. The relationships are where the real meaning lives: which service addresses which problem, which documents support which service, which issues recur in which segment, and so on.
Properties that make it useful, not just pretty. A client node might carry region, contract start, renewal date, value, and owner. A “purchased” relationship might include start date, pricing model, and term length. Without these details, the graph becomes a navigation layer instead of a decision layer.
A lightweight ontology (schema) and governance. “Ontology” can sound academic, but I treat it as the shared vocabulary: what entity types exist, what relationship types exist, and what rules keep the model consistent. Governance matters because graphs decay when everyone invents their own labels or duplicates concepts. (This is also where freshness checks help - see Detecting feature drift in knowledge bases with AI freshness checks.)
Source systems and identifiers you can trust. Most failures I see are not “graph problems,” they are identity problems - multiple names for the same client, inconsistent deal IDs, or documents with no metadata. If the input data is messy, the graph becomes a confident way to be wrong.
Building a knowledge graph from the content you already have
Most B2B service companies already have enough raw material to start: proposals and SOWs, case studies and enablement decks, CRM records, support tickets and chat logs, delivery artifacts, and website content. The build is less about “creating knowledge” and more about shaping and linking what is already there.
Audit and prepare the data (so it is actually usable)
I start by choosing the business outcome first (support deflection, sales enablement, content performance, delivery consistency), then auditing only the sources that matter for that outcome. Otherwise, teams spend months ingesting everything and proving nothing.
Preparation usually means converting PDFs and docs into machine-readable text, stripping boilerplate, deduplicating near-identical assets, and tagging content with basic metadata. This is where I like to set baseline metrics so the graph is not judged on vibes later - for example: ticket volume on top recurring issues, time-to-resolution, organic conversion rate on priority pages, win rate in a target segment, or sales cycle length. If you are dealing with long, messy sales packages, context-aware document search for long RFP packages is a practical adjacent workflow to benchmark against.
Define entities and relationships (the part that decides whether answers will be correct)
This is the point where business context matters more than technology. If the model does not match how the business actually sells and delivers, the graph will produce technically valid but operationally useless answers.
I keep the first version narrow: pick the few entity types you truly need for the chosen use case, define the relationships that connect them, and agree on the minimum properties that make the output actionable. It is normal for early models to be fuzzy (for example, “service,” “package,” and “deliverable” can overlap). I would rather ship a small, consistent model and refine it than attempt a perfect taxonomy that nobody finishes.
Enrich with AI (and control quality so it does not become confident nonsense)
AI is most helpful here for extraction and linking: pulling entities from text, classifying documents into the ontology, detecting relationships (“this case study is about service X in industry Y”), and producing semantic representations of text so you can retrieve relevant snippets even when wording differs.

This is also where I am strict about quality control. Large language models are useful, but they are not inherently accurate - especially with client-specific facts, contract details, or anything regulated. I treat automation as “suggestion first”: sampling and review workflows, clear rules about what can be updated automatically, and explicit access controls for sensitive data. A knowledge graph that leaks client info or propagates incorrect account facts is worse than no graph at all. If you need patterns for locking this down, see Secure AI sandboxes and data access patterns for marketers.
On the implementation side, many teams use Neo4j as the graph database layer - the official python driver is a straightforward entry point if you are integrating from a Python workflow.
Knowledge graph use cases that matter in B2B service companies
I see the strongest outcomes when the graph is built around repeated operational questions - places where people lose time because context is scattered.
Internal knowledge management: the win is faster retrieval and less interruption. Documents become findable through relationships (“show me everything tied to this service, this segment, and this recurring issue”), not just filenames and folders.
Support and success: connecting tickets to issues, clients, deliverables, and documentation tends to reduce repeat work and improve consistency. Even without full automation, agents can get grounded suggestions faster when the system can retrieve both relevant text and the underlying entities involved.
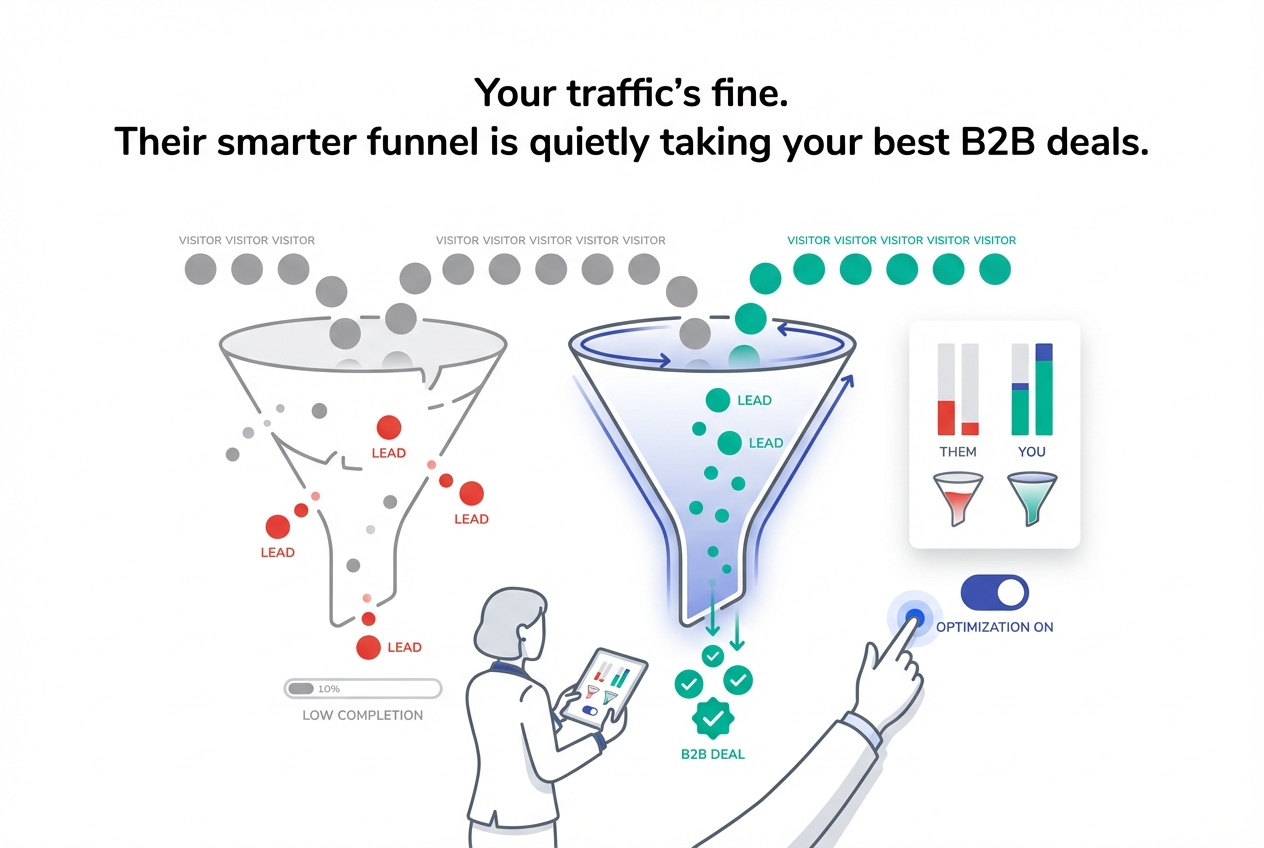
Sales and account intelligence: the graph becomes a 360-degree view that ties together firmographics, past purchases, stakeholders, delivery history, and outcomes. The practical benefit is not novelty - it is reducing reliance on one rep’s memory and making “lookalike accounts” and expansion signals queryable. This pairs well with workflows like AI based win loss analysis marketing and Account intelligence briefs compiled from forums, Git, and docs via AI.
SEO and content strategy: modeling the site and content library as connected topics makes internal linking, hub pages, orphan detection, and coverage gaps much clearer. Instead of planning content page-by-page, you can plan by relationships: which problems map to which services, which segments care about which outcomes, and which pages should reinforce each other.
Implementation realities: scope, timing, team needs, and risk
A knowledge graph initiative can fail in predictable ways. The good news is you can usually avoid the worst outcomes by controlling scope and being honest about constraints.
Common risks I plan for:
- Messy identifiers and duplicated records across systems, which break trust in outputs.
- An over-engineered schema that tries to model everything and ships nothing.
- Skill gaps (data modeling, extraction, governance) that turn a pilot into a permanent experiment.
- Privacy and compliance issues, especially when client data is mixed with AI workflows.
On timeline: a company-wide “everything graph” is a multi-quarter effort. A focused pilot can show value faster, often in the 60-90 day range, if it is tied to a narrow workflow and measured against baselines.
On cost: it varies widely with scope and data access, but I treat cost drivers as predictable - data preparation, integration work, storage/query infrastructure, and ongoing governance. The cheapest graph is the one that answers a small set of high-value questions reliably.
First steps: a simple 90-day pilot outline
When I want momentum without chaos, I keep the plan small and measurable:
- Weeks 1-2: Pick one use case, define success metrics, and inventory only the relevant sources. Draft a lightweight schema that matches how the team already talks about clients, services, and problems.
- Weeks 3-8: Build a working graph with a subset of data and connect it to one real workflow (support search, sales enablement lookup, or content planning). Make it usable by real people, not just analysts.
- Weeks 9-12: Measure impact against baselines, fix the data quality issues the pilot exposes, and expand only where the pilot proves value.
If the pilot does not measurably reduce time, improve consistency, or surface insights the business can act on, treat that as a signal to narrow the scope further - or pause and reassess whether a graph is the right approach for the current maturity level. (In practice, you can also pair this with “decision capture” workflows like Meeting swarm summaries that output decisions, owners, and deadlines via AI so the graph is fed by what teams actually decide.)
How I think about learning more (without vendor noise)
If you want to go deeper, I would focus on three areas: the basics of graph data modeling (entities, relationships, and schemas), graph query concepts (how multi-hop questions are expressed), and linked-data standards that explain how “meaning” is encoded in a structured way. Pair that learning with your own internal baselines and a single concrete use case, and it becomes much easier to judge whether knowledge graphs are a practical next step - or an interesting distraction.
For external reference points, According to McKinsey, knowledge graphs can drive meaningful efficiency and decision improvements in organizations that have repeatable patterns. And if you are building AI workflows on top of your graph, orchestration tools like LangChain are often used to connect retrieval, extraction, and agent-style querying.


.svg)

.svg)
.svg)