
Cloudflare 2025 Data: Googlebot vs AI Crawlers, Robots.txt Blocks & Traffic Shifts
Cloudflare's 2025 Year in Review provides one of the clearest quantifications so far of how Googlebot and AI crawlers interact with the web, how often they send traffic back, and how internet traffic and attacks shifted over the year. For marketing and SEO decision-makers, the numbers confirm that search crawling, AI training, and human traffic are diverging in measurable ways, with direct consequences for robots.txt policy, analytics interpretation, and channel expectations.
Executive snapshot: Googlebot tops AI crawler traffic
- Googlebot reached 11.6% of unique web pages in Cloudflare's October–November 2025 sample - over 3× OpenAI's GPTBot (3.6%) and nearly 200× PerplexityBot (0.06%). [S1][S2]
- Across 2025, AI bots excluding Googlebot averaged 4.2% of HTML requests, while Googlebot alone accounted for 4.5%, slightly more than all other AI crawlers combined. [S1][S2]
- Anthropic bots showed crawl-to-refer ratios of roughly 25,000:1 to 100,000:1, versus 3:1–30:1 for Google Search, indicating orders of magnitude less referral traffic per crawl. [S1][S2]
- AI crawlers (GPTBot, ClaudeBot, CCBot) were the most frequently fully blocked user agents in robots.txt across roughly 3,900 of the top 10,000 domains, while Googlebot and Bingbot were more often partially blocked. [S1][S2]
- Global internet traffic grew 19% year-over-year, post-quantum encryption reached 52% of human traffic (up from 29%), and civil-society organizations became the most-attacked sector, peaking at 23.2% of mitigated traffic in early July. [S1][S2]
Implication for marketers: search crawling remains dominant and tightly coupled to Google's AI training, while most AI agents generate substantial crawl load with limited referral traffic back to publishers.
Method and source notes for Cloudflare AI and traffic data
Cloudflare's 2025 Year in Review aggregates data from its global network, which spans 330+ cities in 125 countries and processes over 81 million HTTP requests per second on average. [S1][S2] The report focuses on traffic that passes through Cloudflare's infrastructure, which includes a large share of high-traffic and security-sensitive sites but does not represent the entire internet.
Key methodological points:
- AI crawler reach analysis - Based on successful requests for HTML content from named AI and search crawlers during October–November 2025, measuring share of unique pages touched by each crawler. [S1][S2]
- Traffic share data - HTML request shares by humans, AI bots, and non-AI bots were measured across Cloudflare's customer base throughout 2025. [S1][S2]
- Crawl-to-refer ratios - Cloudflare computed ratios of crawls to user referrals (click-throughs) for major AI and search platforms across 2025, highlighting how often crawlers visit pages relative to sending traffic back. [S1][S2]
- Robots.txt policies - Robots rules were analyzed for nearly 3,900 of the top 10,000 domains by traffic, focusing on full vs partial disallows by user agent. [S1][S2]
- Security and connectivity - Attack shares, outages, and encryption adoption were measured from mitigated traffic and network telemetry over the year. [S1][S2]
Key limitations and caveats:
- Data reflects sites using Cloudflare services; behavior may differ for properties on other CDNs or self-hosted environments. [S1]
- AI crawler identification depends on user-agent and related signals; undisclosed or mislabeled crawlers may be under-counted. [S1]
- Crawl-to-refer ratios are aggregated and do not show site-level or vertical-level variation. [S1]
- Robots.txt analysis covers a subset of top sites and focuses on declared policy rather than observed enforcement. [S1]
Sources used in this report:
- [S1] Cloudflare, "Cloudflare Radar 2025 Year in Review" (2025).
- [S2] Matt G. Southern, "Cloudflare Report: Googlebot Tops AI Crawler Traffic," Search Engine Journal (Dec 2025), summarizing Cloudflare Radar findings.
Findings: Googlebot and AI crawler traffic in 2025
Cloudflare's 2025 data shows that search and AI crawlers are now a material share of HTML traffic, with Googlebot acting as both a classic search indexer and an AI training agent. [S1][S2] This dual role affects how publishers can manage access without harming discoverability. The subsections below cover crawler reach, traffic share, robots.txt behavior, referral patterns, and broader internet trends.
Reach of major AI and search crawlers
Cloudflare measured how many unique pages were successfully requested by leading AI and search crawlers during October–November 2025. [S1][S2]
- Googlebot reached 11.6% of unique pages in the sample. [S1][S2]
- OpenAI's GPTBot reached 3.6% of pages, less than one-third of Googlebot's reach. [S1][S2]
- Bingbot reached 2.6% of pages. [S1][S2]
- Meta-ExternalAgent and ClaudeBot each reached 2.4% of pages. [S1][S2]
- PerplexityBot reached 0.06% of pages, almost 200× less than Googlebot. [S1][S2]
Cloudflare notes that Googlebot is used both for search indexing and AI model training. [S1][S2] Because of Google's search share, the report states that "Web site operators are essentially unable to block Googlebot's AI training without risking search discoverability." [S1][S2]
AI bots' share of HTML requests and human vs bot mix
Across 2025, Cloudflare tracked the proportion of HTML requests generated by humans, AI bots, and other non-AI bots. [S1][S2]
- AI bots excluding Googlebot averaged 4.2% of HTML requests, ranging from 2.4% in early April to 6.4% in late June. [S1][S2]
- Googlebot alone accounted for 4.5% of HTML requests across the year, slightly more than all other AI bots combined. [S1][S2]
- At the start of 2025, human HTML traffic lagged non-AI bot traffic by about 7 percentage points. [S1][S2]
- By September, human traffic exceeded non-AI bot traffic on some days, and as of 2 December, humans generated 47% of HTML requests, while non-AI bots generated 44%. [S1][S2]
Bot traffic - both AI and non-AI - remains a very large share of all HTML requests, although human traffic regained a relative lead toward the end of the year. [S1][S2]
User-action AI crawling and ChatGPT-linked traffic
Cloudflare distinguishes between model-training crawling and "user action" crawling, where bots visit pages in response to user queries in chat interfaces. [S1][S2]
- User-action crawling volume increased more than 15× from January through early December, making it the fastest-growing AI crawling category. [S1][S2]
- The pattern closely followed traffic from OpenAI's ChatGPT-User bot, which visits pages when ChatGPT needs live content to answer user questions. [S1][S2]
- A clear weekday pattern became visible from mid-February, with lower volumes during weekends. Usage dropped in June–August, matching school breaks and vacation periods. [S1][S2]
This suggests that a meaningful share of AI-driven visits is now directly tied to how often users query tools like ChatGPT, rather than background training alone. [S1][S2]
Robots.txt blocking and publisher responses to AI crawlers
Cloudflare examined robots.txt rules for nearly 3,900 of the top 10,000 domains by traffic and found AI crawlers to be the most heavily blocked category. [S1][S2]
- GPTBot, ClaudeBot, and CCBot had the highest number of full
Disallowdirectives, instructing them not to crawl any part of the site. [S1][S2] - Googlebot and Bingbot saw more partial disallows, typically focused on login endpoints and non-content directories rather than full-site blocking. [S1][S2]
This pattern indicates that many large sites differentiate between AI-only crawlers used primarily for training and mixed-purpose crawlers (Googlebot, Bingbot) linked to core discovery channels. [S1][S2]
Crawl-to-refer ratios across AI and search platforms
Crawl-to-refer ratios express how many crawls a platform performs for every user visit it sends back to a site. A higher ratio means more crawling relative to referrals. [S1][S2]
- Anthropic (Claude) had the highest ratios among AI platforms, ranging from roughly 25,000:1 to 100,000:1 in the second half of the year, after early volatility. [S1][S2]
- OpenAI reached crawl-to-refer ratios as high as 3,700:1 in March, with some decline later in the year as ChatGPT search usage grew. [S1][S2]
- Perplexity maintained the lowest ratios among major AI platforms, generally below 400:1 and under 200:1 from September onward. [S1][S2]
- Google Search maintained far lower ratios, typically 3:1–30:1, reflecting a closer relationship between crawling and click-through traffic. [S1][S2]
Cloudflare interprets these results as confirmation that AI platforms, particularly Anthropic and OpenAI, crawl heavily while sending comparatively little traffic back to publishers. [S1][S2]
Broader Cloudflare internet traffic, security, and connectivity trends
The Year in Review also covers macro-level shifts in traffic, encryption, AI usage, and attacks. [S1][S2]
Traffic and connectivity:
- Global internet traffic grew 19% year-over-year, with relatively flat growth through mid-April and an acceleration after mid-August. [S1][S2]
- Starlink traffic doubled during 2025 as coverage expanded to more than 20 new countries. [S1][S2]
- Cloudflare logged 174 major internet outages worldwide; nearly half were attributed to government-directed shutdowns. Cable-cut outages dropped by almost 50%, while outages due to power failures doubled. [S1][S2]
- European countries dominated Cloudflare's internet quality metrics. Spain ranked first overall, with average download speeds above 300 Mbps. [S1][S2]
Security and encryption:
- Organizations in the "People and Society" vertical - including religious institutions, nonprofits, civic groups, and libraries - became the most-attacked sector for the first time, receiving 4.4% of global mitigated traffic versus under 2% at the start of the year. [S1][S2]
- Attack share against this sector exceeded 17% in late March and peaked at 23.2% in early July, many under Cloudflare's Project Galileo protections. [S1][S2]
- The gambling and games sector, the top target in 2024, dropped to 2.6% of mitigated attack traffic, more than a 50% decrease. [S1][S2]
- Post-quantum encryption protected 52% of human traffic to Cloudflare properties by late 2025, up from 29% at the start of the year. [S1][S2]
AI service usage:
- ChatGPT remained the top generative AI service globally. [S1][S2]
- Google Gemini, Windsurf AI, Grok/xAI, and DeepSeek entered Cloudflare's top 10 list of generative AI services. [S1][S2]
Interpretation and implications for SEO, content access, and security
This section is interpretation based on the findings above. Inference strength is noted for each point.
Googlebot's dominance and constrained blocking options
Likely: Because Googlebot accounts for both search indexing and AI training, and touches roughly 11.6% of pages in Cloudflare's sample - over 3× GPTBot and about 200× PerplexityBot - site owners have limited practical ability to separate "search" from "AI" access where Google is concerned. [S1][S2]
- Blocking Google's AI training via Googlebot would almost certainly affect crawling for organic search, given the shared infrastructure.
- This creates an asymmetry: publishers can block GPTBot, ClaudeBot, or CCBot entirely and still remain visible in major search engines, but cannot do the same for Googlebot without trade-offs.
Implication: For most commercial sites, robots.txt is likely to remain permissive for Googlebot and Bingbot, with stronger restrictions targeted at AI-only crawlers. This aligns with Cloudflare's observed pattern of full disallows for GPTBot/ClaudeBot vs partial disallows for Googlebot/Bingbot. [S1][S2]
AI crawling load vs referral value
Likely: Crawl-to-refer ratios indicate that, for now, AI platforms bring relatively low direct traffic value per unit of crawl load compared with search engines. [S1][S2]
- Anthropic ratios of 25,000:1–100,000:1 signal intensive crawling with very limited click-throughs.
- OpenAI's high ratios (up to 3,700:1) confirm similar dynamics, though the downward trend later in the year suggests modest improvement as ChatGPT search and link-out features expand.
- Perplexity's ratios (below 400:1 and under 200:1 from September) are closer to search-like behavior but still well above Google's 3:1–30:1 range.
Implication (Tentative): For publishers concerned about infrastructure cost or data usage, blocking high-ratio AI crawlers may be rational where legal, since they contribute measurable load with limited direct traffic upside. For platforms with lower ratios (Perplexity, and especially Google Search), the trade-off leans more toward allowing access.
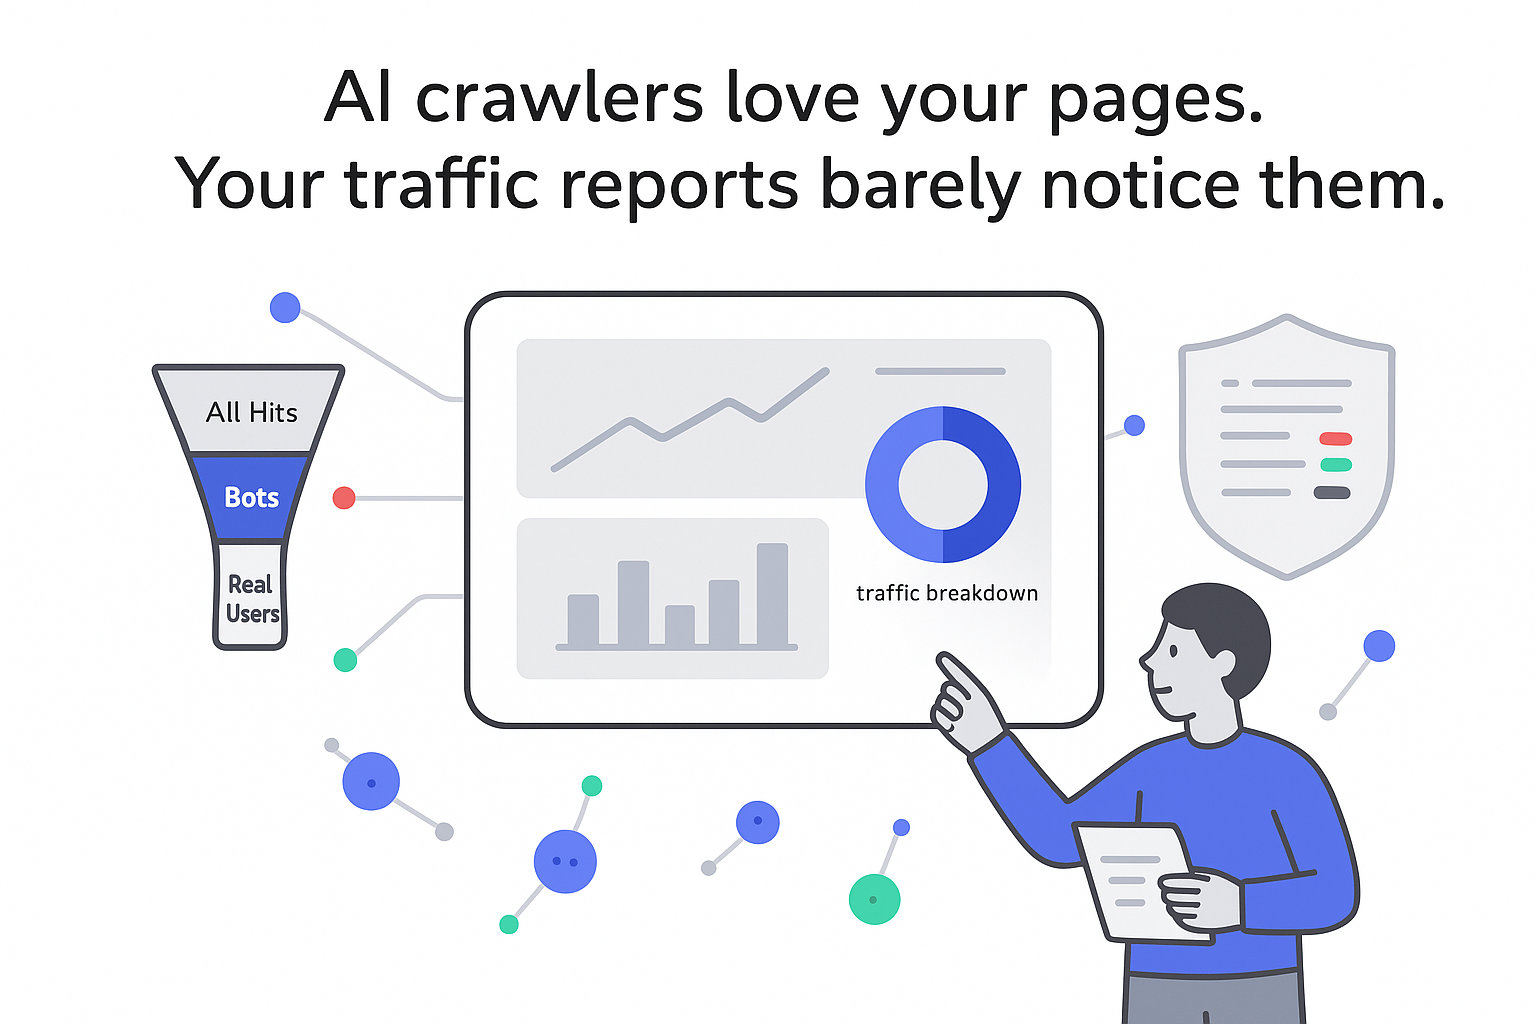
Human vs bot traffic and analytics interpretation
Likely: With AI bots (excluding Googlebot) at about 4.2% of HTML requests, Googlebot at 4.5%, and non-AI bots representing another large share, bots collectively still account for roughly half of traffic to many Cloudflare-served sites. [S1][S2]
The shift in late 2025, where human HTML traffic reached 47% vs 44% for non-AI bots, improves the human share but does not remove the need to segment bots in analytics. [S1][S2]
Implication (Likely): Marketers relying on raw pageview counts risk overestimating human reach and engagement unless analytics filters are carefully configured. Differentiating Googlebot, AI bots, and other crawlers is increasingly important when evaluating campaign impact or content performance.
User-action AI crawling as an emerging discovery channel
Tentative: The 15×-plus rise in user-action crawling tied to ChatGPT-User suggests that some share of AI-driven visits are now user-initiated and could represent early-stage demand capture, even if referral volumes remain modest overall. [S1][S2]
- The pronounced weekday and academic-year pattern implies significant usage in education and office contexts, where AI agents may serve as intermediaries to web content.
Implication (Tentative): Content that answers specific, factual questions in a structured way (clear headings, concise explanations, machine-readable formats) may be more likely to be surfaced or quoted by AI agents that actively visit pages in response to user questions. Direct traffic impact is still limited, but the visibility effect - content being read and synthesized by AI tools - is expanding.
Robots.txt strategy and content segmentation
Likely: The robots.txt data shows a de facto standard emerging among large sites: [S1][S2]
- Allow Googlebot and Bingbot broadly (with partial blocks for non-content paths).
- Fully disallow GPTBot, ClaudeBot, CCBot and similar AI-only agents where desired.
Implication (Likely): For sites managing compliance, licensing, or premium content, separating public marketing and informational content from high-value or sensitive content zones becomes more important. Robots.txt, combined with authentication and technical barriers, is being used as a coarse control layer for AI training access.
Sector-specific security exposure
Likely: Civil-society and nonprofit organizations now face materially higher cyberattack rates than many commercial sectors, with mitigated traffic share peaking at 23.2% in early July 2025. [S1][S2]
Implication (Likely): Agencies and vendors serving advocacy, religious, or civic clients should assume elevated baseline attack risk. Security posture, redundancy, and incident response planning are not just technical issues but should be factored into communication and campaign timing for this segment.
Macro traffic, AI adoption, and quality of access
Tentative: The 19% year-over-year traffic growth, rapid rise of post-quantum encryption (29% to 52% of human traffic), doubling of Starlink usage, and dominance of European countries in quality metrics indicate a network environment where: [S1][S2]
- More traffic is flowing over encrypted, modern protocols.
- Satellite connectivity is expanding reach, especially in regions previously under-served by fixed broadband.
- High-bandwidth markets (for example, Spain with above 300 Mbps average download speeds) can support richer formats such as video and interactive experiences more reliably.
Implication (Tentative): Content and campaign formats can be more ambitious in high-quality access markets, while regions with fragile connectivity or exposure to government shutdowns may need lighter, more resilient approaches.
Contradictions and data gaps around AI crawling and traffic
Several uncertainties and gaps remain in the available data:
- Causal link between AI crawling and search rankings - Cloudflare's data shows Googlebot's dual role but does not quantify how AI-related crawling specifically affects rankings or visibility. Any such link remains speculative. [S1]
- Vertical-level variation - Crawl-to-refer ratios and AI bot shares are reported in aggregate. Certain sectors (news, technical documentation, communities) may experience very different ratios, but this is not broken out. [S1]
- Non-disclosed AI crawlers - The analysis relies on known user-agents. If AI companies use generic or obfuscated agents, their activity may not be fully captured, leading to under-estimation of total AI crawling. [S1]
- Effectiveness of robots.txt blocks - Robots.txt policies indicate publisher intent, not guaranteed behavior. The report does not evaluate whether all AI agents consistently honor disallow rules. [S1]
- Traffic quality from AI referrals - Cloudflare's ratios show volume of referrals, not engagement depth, conversion behavior, or revenue quality of visitors arriving via AI tools.
These gaps mean that decisions about blocking or allowing specific crawlers still require site-specific testing, legal review, and monitoring beyond the aggregate numbers.
Data appendix and reference figures
Selected quantitative highlights from Cloudflare's 2025 Year in Review, as reported in [S1][S2]:
| Metric | Value / Range | Period / Notes |
|---|---|---|
| Googlebot page reach | 11.6% of unique pages | Oct–Nov 2025 sample |
| GPTBot page reach | 3.6% | Oct–Nov 2025 |
| Bingbot page reach | 2.6% | Oct–Nov 2025 |
| Meta-ExternalAgent page reach | 2.4% | Oct–Nov 2025 |
| ClaudeBot page reach | 2.4% | Oct–Nov 2025 |
| PerplexityBot page reach | 0.06% | Oct–Nov 2025 |
| AI bots' share of HTML requests (excluding Googlebot) | 4.2% average (2.4%–6.4% range) | 2025 |
| Googlebot share of HTML requests | 4.5% | 2025 |
| Human vs non-AI bot HTML (2 Dec 2025) | 47% human vs 44% non-AI bots | 2 Dec 2025 |
| User-action crawling growth | >15× increase | Jan–early Dec 2025 |
| Anthropic crawl-to-refer ratio | Approximately 25,000:1–100,000:1 | H2 2025 |
| OpenAI crawl-to-refer ratio | Up to 3,700:1 | March 2025 peak |
| Perplexity crawl-to-refer ratio | <400:1, then <200:1 | 2025; under 200:1 from Sept |
| Google Search crawl-to-refer ratio | Approximately 3:1–30:1 | 2025 |
| Attack share to People & Society | 4.4% average; peak 23.2% | Up from <2%; peak early July |
| Gambling/games attack share | 2.6% | Down >50% from 2024 |
| Global internet traffic growth | +19% year-over-year | 2025 |
| Post-quantum encryption share of human traffic | 29% → 52% | Jan → late 2025 |
| Major internet outages | 174 total | Approximately 50% government-directed |
| Starlink traffic | 2× | 2025 vs prior year |
| Spain average download speed | >300 Mbps | Top overall quality |
These figures summarize the quantitative backbone for the interpretations presented above and can be used for internal planning, forecasting, and technical discussions with SEO, infrastructure, and security teams.


.svg)

.svg)
.svg)